AI Strategy Finder
The AI's results
Reading the list of strategies the AI generated.
The AI's search at a glance: the boxes at the top
#Strategies generated — how many the search kept (up to 200). Passed every test — how many of them passed all 8 robustness tests. History used — the dates the search used.
Top AI strategies first, then the rest
#The list starts with Top strategies — passed all 8 robustness tests, highlighted in light green. A top strategy also meets the return requirement after taxes and slippage on its starting capital. Below a line come the Other strategies: they failed at least one test. They are still shown, so you can study them, but treat them with more care.
No two strategies in a search are look-alikes: when a strategy trades almost like a better one, only the better one is shown, so the top strategies are genuinely different from each other.
Each row shows the strategy's name (a short made-up name such as Silent Rocket, only to tell them apart), whether it is long, short or both, its 10-digit ID, and its entry and exit rules. The line under the search's title says whether the whole search is intraday or positional. The list is sorted by net profit, highest first, inside each section.
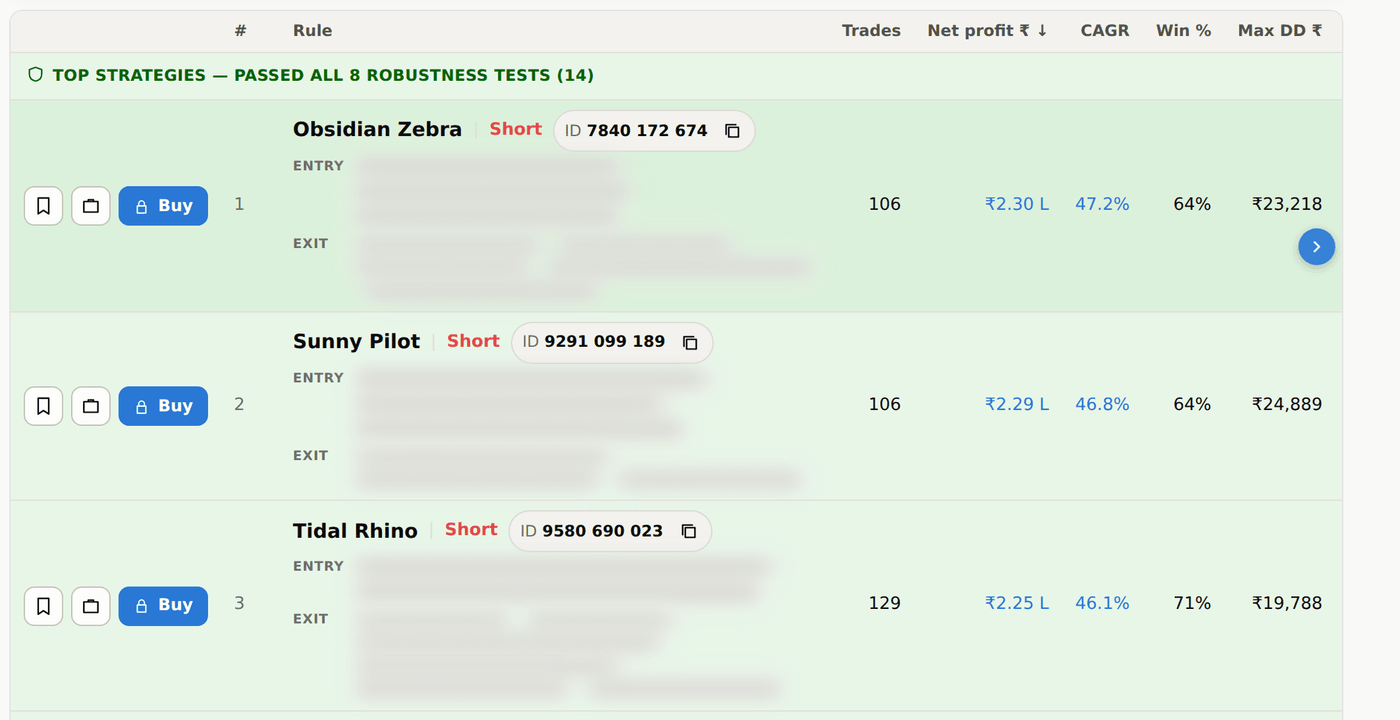
Reading the AI's columns
#Profit and drawdown are in ₹ for one lot, after the costs ticked above the list. Hover over any column heading to see what it means.
- Trades — how many trades it made.
- Net profit ₹ — total money made, minus money lost.
- Win % — share of trades that made money.
- PF (profit factor) — money made on winning trades ÷ money lost on losing trades. 1.5 means ₹1.50 made for every ₹1 lost.
- Max DD ₹ (drawdown) — the biggest fall from a high before a new high, in ₹.
- Ret/DD — net profit ÷ max drawdown. Higher means more profit for the pain.
- Sharpe — how steady the daily profit was. Above 1 is good, above 2 is very good.
- The last columns are the 8 tests: a green tick means passed, a red cross failed, a dash means not run. Hover over a heading to see the test's name and what it checks.
Filtering the AI's list
#- Signal direction of the underlying — Any, Long, Short or Long + Short.
- Filter — pick what to filter on (min trades, min net profit, min CAGR, min win %, min profit factor, max drawdown, min return ÷ drawdown, min Sharpe), type the value and press Add. Each filter shows as a chip under the box; add several, remove one with its ×.
- Must pass — a drop-down of the 8 tests, each with the short name its column uses (for example Monte Carlo Trade Resampling (MC)). Tick tests to see only strategies that passed them. Nothing is ticked at first.
- Click any column heading to sort by it; click again to reverse.
Costs on the AI's results: brokerage, taxes & charges, slippage
#Three ticks re-price every strategy on the page. Brokerage — your broker's charge; click the amount to set it per order (a trade is two orders) or per lot. Taxes & charges — STT, exchange charges, SEBI fee, stamp duty and GST, worked out for you; click what's included to see them. Slippage — the difference between the price you wanted and the price you got, at entry and again at exit; click the amount to change it.
Ticking a box changes only what you see. The search itself always took out taxes and slippage.

When the AI finds few or no top strategies
#When a first round finds no strategy that passes all 8 tests, the search quietly keeps looking with new combinations before it shows you the result, at no extra cost. If there is still none after that, you see all the strategies it generated, under Strategies generated.
A strategy can pass every check except the return requirement: it holds up, but earns too little on its capital to be a top strategy. Try longer dates, another chart timeframe, or another index.