AI Strategy Finder
Investing strategies with AI
Strategies for stocks and ETFs that you hold for days, months or years — found and tested by our AI on daily prices.
What Investing is?
#Trading finds strategies for the index, trade by trade. Investing does the same for a portfolio of stocks or ETFs: which ones to buy, when to sell them, and how many to hold at a time. Switch to it with the Trading | Investing switch at the top of Find strategies.
Our AI tries thousands of combinations of stock-picking rules, holding periods and exits on daily prices of every stock in the universe you choose, keeps the best and puts each through 8 robustness tests built for portfolios. The ones that pass all 8 are shown first, in green — exactly like trading.
Every result is a complete model portfolio: equal money in each stock, the buys and sells it made, its growth year by year next to the index's.
Who it suits, and who it does not?
#It suits investors who want rules for choosing and selling stocks — momentum, chart patterns, moving averages — instead of tips, and who will act on a list of buys and sells at the next open.
It does not suit someone who wants intraday trades (use Trading), or who wants company numbers like earnings and debt in the rules: Company numbers shows coming soon for now.
The Investing form, card by card
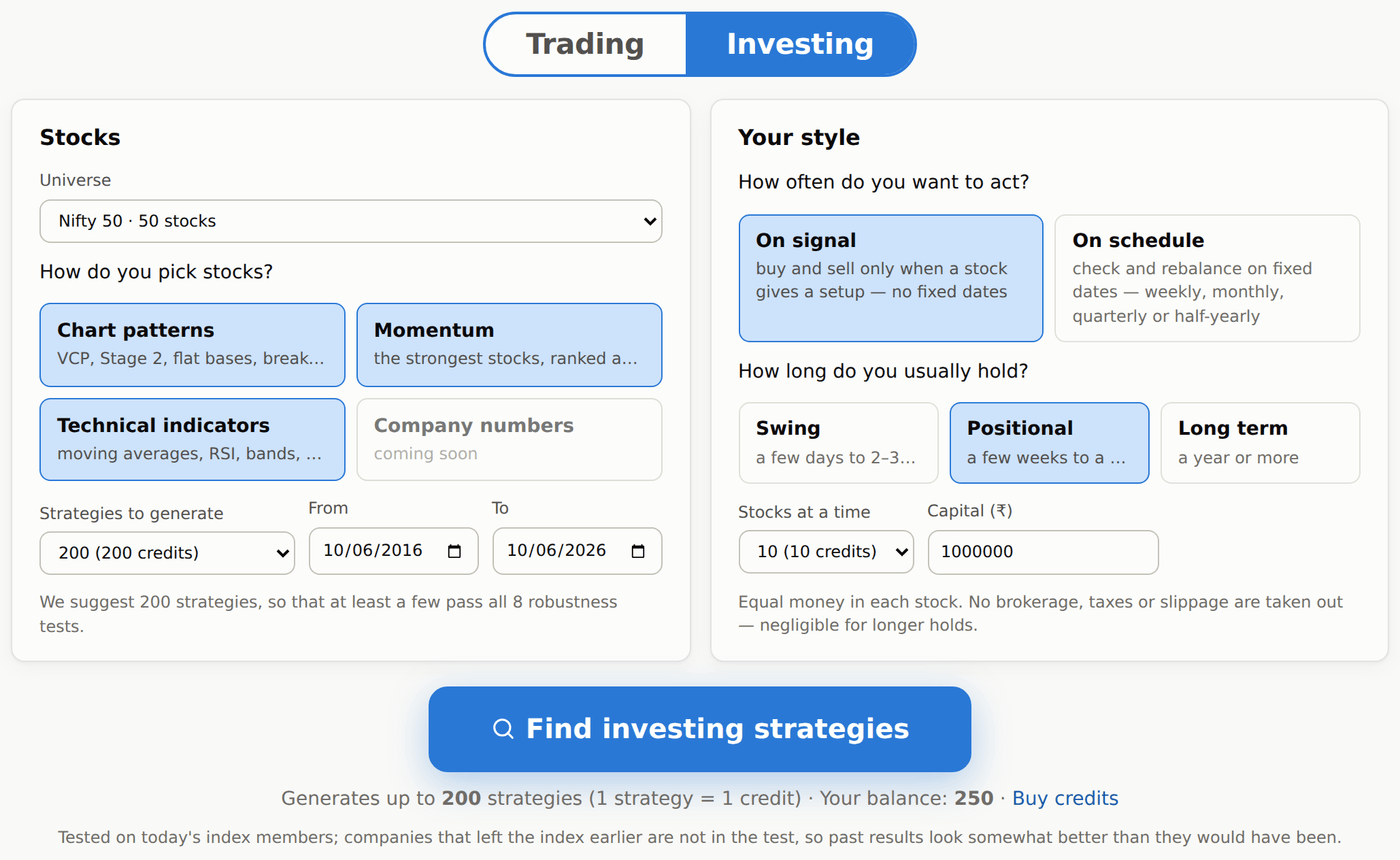
#The left card is Stocks, the right card is Your style:
- Universe — Nifty 50, Nifty 100, Nifty 200, Nifty 500, Nifty Midcap 150, Nifty Smallcap 250, ETFs, or one of your own lists (My lists, below).
- How do you pick stocks? — Chart patterns (VCP, Stage 2, flat bases, breakouts, Darvas box…), Momentum (the strongest stocks, ranked and rebalanced) and Technical indicators (moving averages, RSI, bands, candles…). Tick one or more; the AI mixes them.
- Strategies to generate — 25, 50, 100 or 200 (the default; 1 strategy = 1 credit), and the dates. The dates start with the last 10 years.
- How often do you want to act? — On signal: buy and sell only when a stock gives a setup, no fixed dates. On schedule: check and rebalance on fixed dates (see Rebalancing).
- How long do you usually hold? — Swing (a few days to 2–3 weeks), Positional (a few weeks to a few months) or Long term (a year or more). It decides which exits and rebalance dates the AI tries.
- Stocks at a time — 5, 10, 15, 20 or 30, and Capital (₹) — ₹10,00,000 to start with. The capital is split equally between the stocks held.
Stocks, ETFs and the price history
#The prices are daily closes of NSE stocks, adjusted for splits and bonus issues, so a 1:1 bonus never looks like a 50% fall. The index histories start in 2006 (Nifty Midcap 150 in 2005, Nifty Smallcap 250 in 2019).
ETFs is a list of 33 liquid ETFs — the most traded one for each thing they track (one gold ETF, one Nifty 50 ETF, one Nasdaq ETF and so on), so the AI never holds two ETFs that are really the same. Liquid-fund, gilt and bond ETFs are left out. Their results are compared with the Nifty 50.
The index lists use today's members. Companies that left the index earlier are not in the test, so past results look somewhat better than they would have been. The page says this under the button, and it is true of every investing backtest built this way.
How a stock is sold: the exits?
#The AI chooses each strategy's exits: a stop loss, a target (or none), a trailing stop and trail to cost. Depending on the holding period it can also add a time exit (sell after a number of trading days) or an exit rule such as close below the 50-day average.
Example: a stock bought at ₹1,000 with a stop loss of 10%, a trailing stop of 5%, trail to cost at 10% and a target of 15%. The stop starts at ₹900. At ₹1,050 the trailing stop moves it up to ₹950. At ₹1,100 it moves to ₹1,000 — the buy price, which is also what trail to cost does at 10% up. At ₹1,150 the target sells it.
On schedule strategies keep only a stop loss (or none): otherwise a stock is sold when it drops out of the ranking at a rebalance. The result rows say when it drops out at a rebalance in that case.
Rebalancing
#An On schedule strategy ranks the stocks on fixed dates and holds the top ones. Rebalance offers Let AI choose, Weekly (Mondays), Monthly, Quarterly and Half-yearly. With Let AI choose, the AI picks a rebalance that suits your holding period.
The ranking uses the close of the last trading day of the period, and the buys and sells happen at the next open. Weekly means Monday's open — or Tuesday's when Monday is a market holiday.
Every rebalancing strategy carries a tag on its row and its page, for example Rebalances weekly (Mondays), so you always know when it will ask you to act.
The results
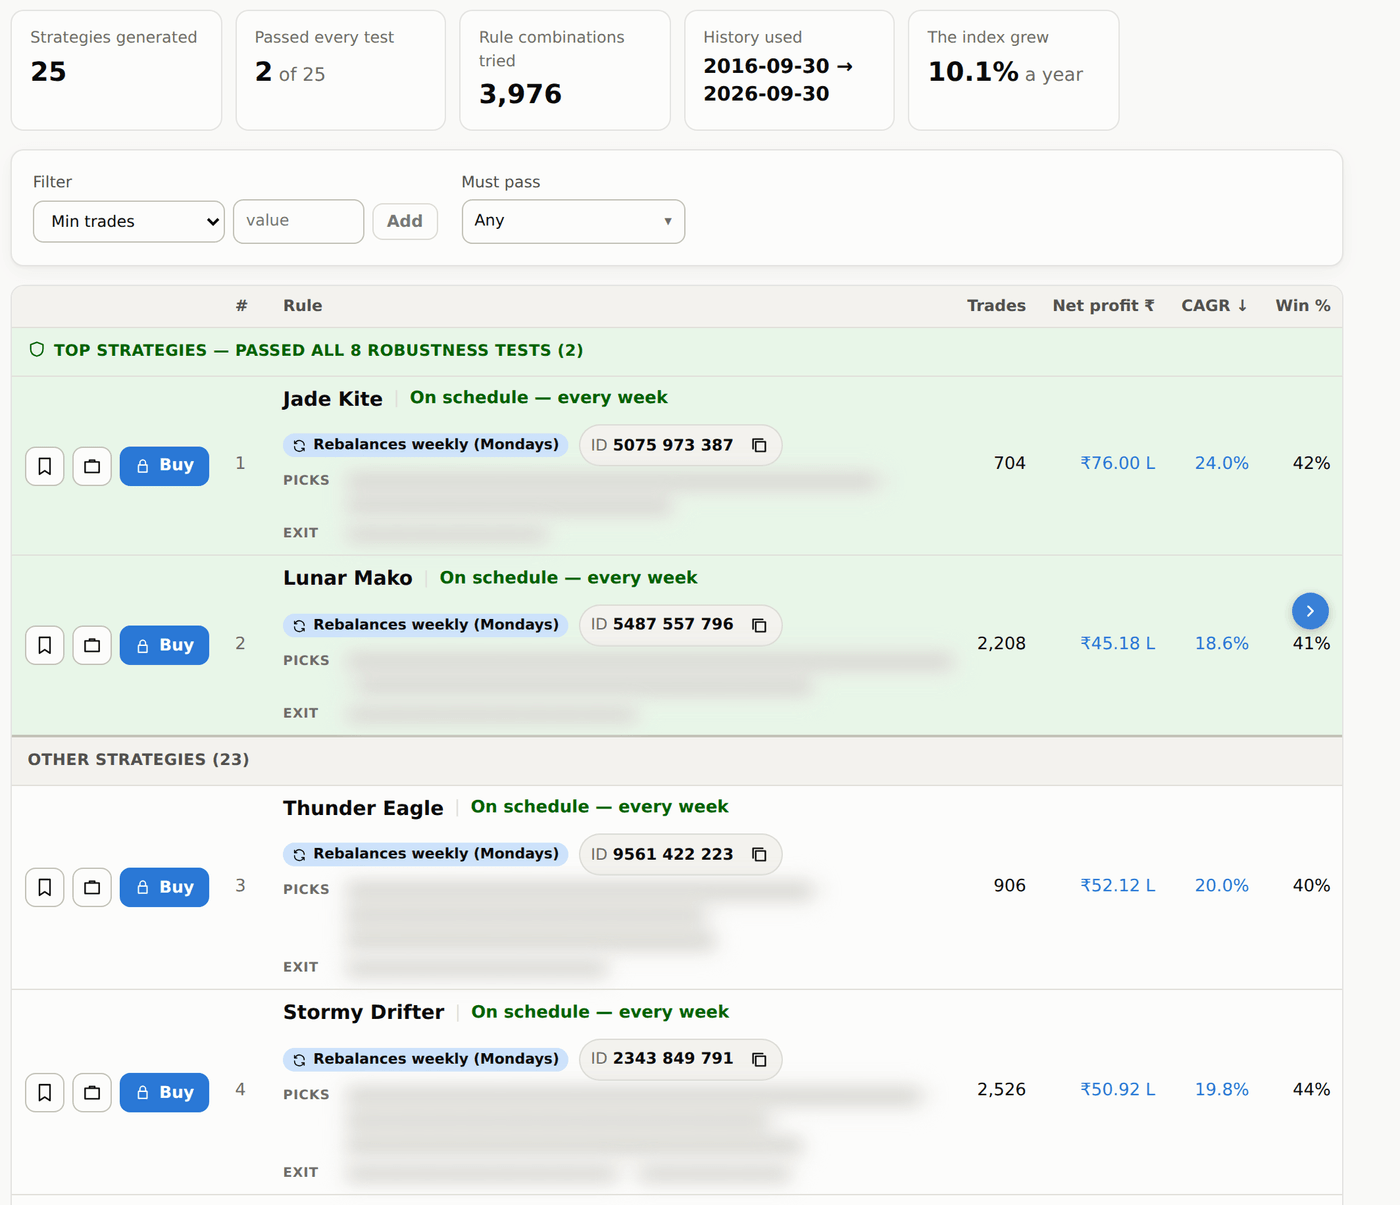
#The results look like trading results. At the top: Strategies generated, Passed every test, History used and how much The index grew in a year. Each row shows the rule in short (Entry or Picks, then Exit), Trades, Net profit ₹, CAGR, Win %, Max DD, PF and Sharpe, then one badge for each of the 8 tests.
Profit and drawdown are for the whole portfolio on its starting capital. Brokerage, taxes and slippage are left out: for positions held weeks to years they are small next to the moves.
The 8 tests for investing:
- Unseen years hold up and beat the index — in recent years, which the search never saw, it kept its growth and beat the index.
- Beats random picks — it clearly beats portfolios built the same way from random rules or random rankings.
- Survives bad luck in the order of months — histories drawn from its own months, in other orders, still end in profit.
- Nearby settings also work — slightly different settings work too; not one lucky number.
- Survives buying and selling a day late — buying and selling late still makes money.
- Profitable in most periods — it made money in most periods, not in one lucky stretch.
- Walk-forward — settings chosen only on older years kept working in the years that followed.
- Not dependent on a few stocks — tested on different subsets of the stocks, it still made money.
An investing strategy's page
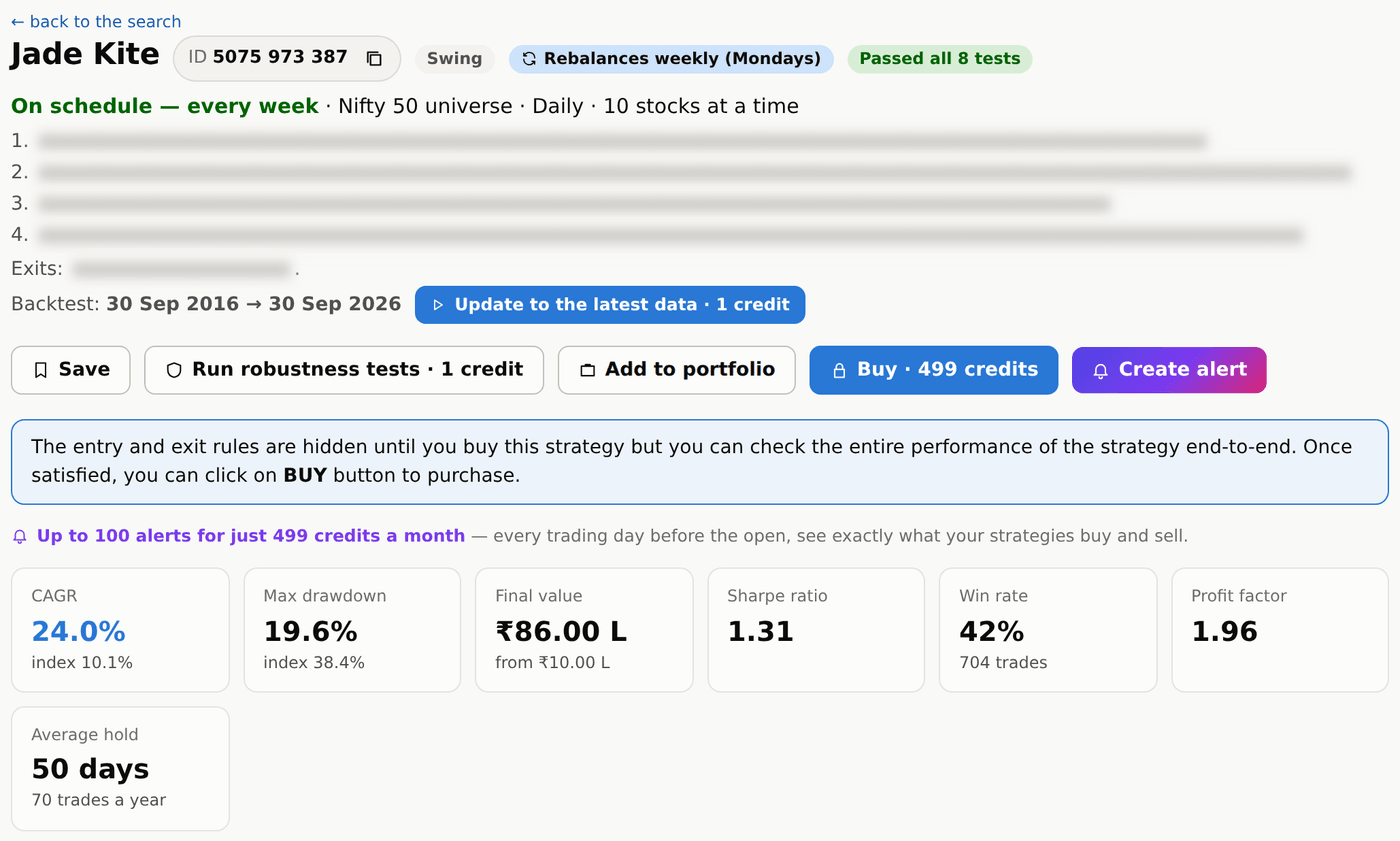
#Click a row for the full report: the CAGR, Max drawdown and Final value next to the index's, the Sharpe ratio, Win rate, Profit factor and Average hold, and the tabs Overview, Robustness, Monte Carlo, Seasonality, Holdings & stocks and Trades. Holdings & stocks shows what the strategy holds now, its Next buys, and which stocks the money came from.
The buttons: Save, Run robustness tests · 1 credit, Update to the latest data · 1 credit (when newer prices exist), Add to portfolio, Buy · 499 credits and Create alert. The rules stay blurred until you buy the strategy; before that, Create alert asks you to buy it (or to log in first). Once bought, Create alert opens My alerts and starts an alert that tells you before every open which stocks it buys and sells (up to 100 alerts for 499 credits a month). Alerts belong on the strategy's page; the rows of a search do not have the button.
On a purchased investing strategy, press Deploy beside Alert to open Investing Terminal. It supports daily-signal and scheduled momentum strategies. Review the imported rules, allocate capital per broker account and choose any starting model stocks before enabling entries. You need an active paid Investing Terminal subscription or Platinum access; trials cannot deploy. There is no separate deployment fee or My Alerts subscription requirement. See Investing Terminal.
My lists: search on your own stocks
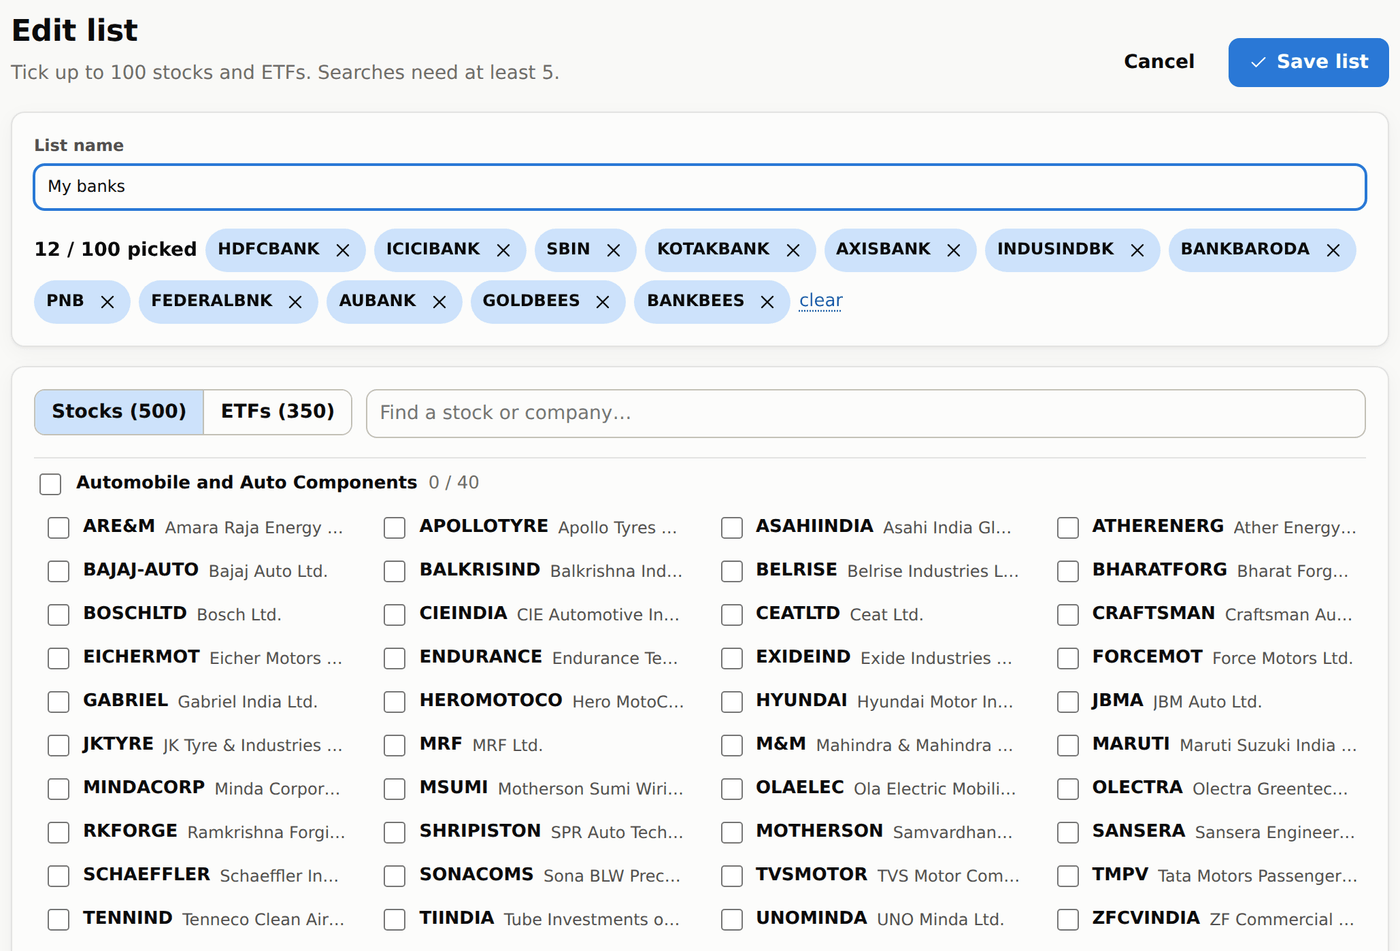
#My lists (in the left menu) lets you make your own universes. Press Add list, type a name in List name at the top (for example My banks or Sector ETFs), and tick stocks and ETFs from the two tabs — every Nifty 500 stock and every NSE ETF is there. Liquid only shows just the 33 ETFs of the ETFs universe; many of the others hardly trade.
A list holds up to 100 stocks and ETFs, and you can keep up to 20 lists. A search needs at least 5. Find strategies on a list opens the Investing form with that list chosen, and your lists also appear under My lists in Universe.
Every time you save a list it becomes a new version. A strategy found on a list keeps the stocks it was found on, so editing the list later never changes its results or its alerts.
What Investing costs?
#- A search uses 1 credit for each strategy it generates — 200 credits for a search of 200 — the same as trading. Visitors cannot run investing searches; a free account can.
- Buy costs 499 credits and opens the strategy's rules for good.
- Run robustness tests and Update to the latest data cost 1 credit each.
- Alerts: up to 100 alerts for just 499 credits a month, on the My alerts page.
What it cannot do?
#- It does not buy or sell anything. It finds and tests portfolios; placing the orders is your decision.
- It cannot promise the future. A portfolio that beat the index for 10 years can lag it for the next 2.
- It is not investment advice, and it does not look at company results, news or valuations.
- It tests on today's index members, which flatters past results (see Stocks, ETFs and the price history).
If something looks wrong
#- The button says Create a free account to find investing strategies — investing searches need an account. Create one, or log in.
- The button says Buy credits to generate strategies — your balance is below 10 credits.
- My list is greyed out in Universe — it has fewer than 5 stocks and ETFs. Add more on My lists.
- Few strategies in green — common with small universes and short dates. Try a bigger universe, or keep the 10-year dates.