Discretionary Trading Tools
Trade Scalper Option Chain
How to read the option chain — call side, put side, strikes and ATM — with a picture of the real screen.
What the option chain shows?
#The option chain lists every strike for your chosen underlying, with the call side on the left, the strike prices down the middle, and the put side on the right.
It opens centred on ATM — the strike nearest the current price of the index. That is the row most traders start from, so you should not have to scroll to find it.
Each side shows the live price (LTP) and delta, with buy and sell buttons beside them. Turning the toggle in the header OFF stops the live updates; turning it ON starts them again and re-centres on ATM.
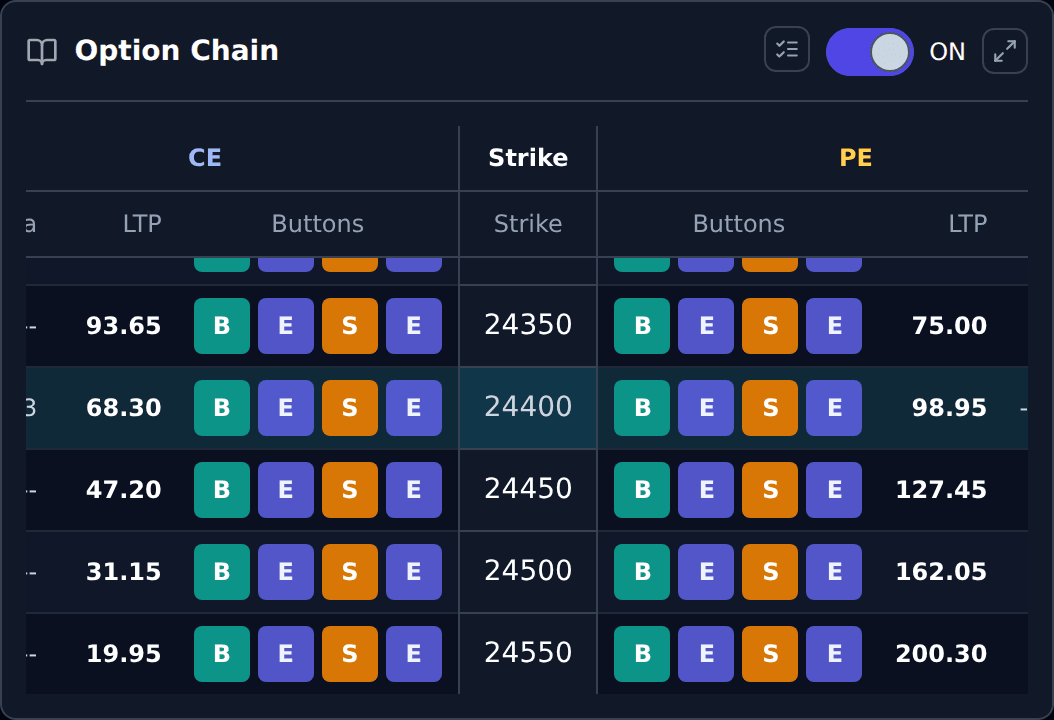
The call side (CE)
#The CE columns on the left are call options. A call gains value when the index goes up.
Reading the picture above: at strike 24250 the call costs 124.05. Lower strikes cost more — at 24200 the call is 151.00 — because they are already closer to being in profit.
The delta column tells you roughly how much the option moves for a 1-point move in the index. At ATM it is around 0.5, so a 10-point move in NIFTY moves that option about 5 points.
The put side (PE)
#The PE columns on the right are put options. A put gains value when the index goes down.
The pattern runs the opposite way to calls: at 24250 the put costs 140.50, and at the higher strike 24300 it costs more, 166.35.
Put deltas are shown as negative numbers for the same reason — the option moves against the index.
The strike column in the middle
#The middle column is the strike price itself, and the highlighted row is ATM.
Strikes above ATM are OTM for calls and ITM for puts; below ATM it is the other way round. You do not have to memorise that — the prices tell the same story, because the cheaper side is always the out-of-the-money one.
Clicking a strike selects it for the trade ticket, so the quickest way to trade a particular option is to find its row first.
Snapshot vs live prices
#With a connected broker, the chain updates continuously as the market moves.
Without one — logged out, or with the broker disconnected — you still see the chain, but as a snapshot that does not tick. It is useful for looking around; it is not safe to trade from, because the price you see may already be stale.
If the chain looks frozen, check the broker connection first. That is the usual cause.