Strategy Automation Tools
Trade Builder Indicator Signals
Build indicator-based algo strategies from platform-native signals such as RSI, EMA, and MACD — every field explained.
Overview
#Trade Builder creates strategies from indicator conditions you build inside the platform. When your conditions become true on an official candle close, the strategy trades your configured legs automatically.
You do not need TradingView, webhooks, or any external system. Pick an underlying, build the conditions from dropdowns, configure the execution legs, and activate.
Strategy Name
#Strategy Name is the label for the indicator strategy.
Use a clear name such as NIFTY RSI Buy or SENSEX EMA Crossover.
Symbol
#Symbol is the index underlying used for the indicator calculation and the trade.
Trade Builder supports NIFTY, BANKNIFTY, and SENSEX index options.
Reference Price (Spot / Futures)
#Reference Price decides which price series your conditions are calculated on and which price is used for strike selection: the index spot or the current-month future.
Most strategies use Spot. Prefer Spot for 1-day timeframe conditions, because a futures contract only has a few months of daily history.
Long and Short signals
#A strategy has a Long signal block and a Short signal block. Each block has its own entry conditions, exit conditions, and execution legs.
Use only the block you need. An active block must have at least one entry condition.
Condition rows
#Each condition row reads like a sentence: something, compared to something, on a timeframe. Example: RSI (14) crosses below 30 on 5m.
The left and right side of a condition can be an Indicator, a Candle price (open, high, low, close, volume), a Highest / Lowest / Average of the last few candles, or a fixed Number.
Rows are joined by AND / OR chips — click the chip between two rows to switch the logic. Sub-conditions let you nest logic up to 3 levels, with up to 20 conditions per tree.
The "In plain words" line below the builder always shows your full rule as a sentence — read it back before saving.
Which candle (this candle, previous candle, up to 5 back)?
#Every side of a condition has a candle dropdown: this candle, previous candle, 2 candles ago, and so on up to 5 candles ago. this candle means the candle that just closed.
This lets you build rules purely out of candles, with or without indicators. Example: candle close is above candle close (previous candle) means this candle closed higher than the one before it.
Both sides can use different candles. Example: candle high is above candle high (2 candles ago).
It works on indicators too. Example: RSI (14) is above RSI (14) (previous candle) means RSI is rising.
If your strategy has not collected enough candles yet, the condition simply stays false until it has — it never fires on incomplete data.
Highest / Lowest / Average of the last N candles
#Choose Highest / Lowest on either side of a condition to compare against the highest, lowest, or average value of the last few candles (2 to 100). It works on the market values too — ATM straddle price, India VIX, ATM IV, put-call OI ratio and options volume — over up to 300 candles.
Breakout example: candle high is above highest high of the last 5 candles (previous candle). Setting the candle dropdown to previous candle leaves the current candle out, which is what a breakout means — the price is breaking the range of the candles before it.
Breakdown example: candle low is below lowest low of the last 10 candles (previous candle).
This replaces writing five separate rows and joining them with AND.
Adding a +/- margin
#The small ± button on a condition side adds a margin in percent or points, so a level has to be cleared by a real move instead of a single tick touching it.
Example: candle close is above candle high (previous candle) + 0.2% only triggers if price closes clearly above the previous high, not merely equal to it.
A negative value subtracts, so you can also make a level easier to reach.
Volume
#Volume is available as a candle value like open, high, low, and close.
Index spot (NIFTY, BANKNIFTY, SENSEX) has no volume of its own, so volume is always taken from that index's current-month future — the platform does this automatically, whether your strategy is set to Spot or Futures. Your rule is never compared against a zero.
Example: candle volume is above average volume of the last 20 candles (previous candle) means this candle traded more than the recent average.
Describe your rule in plain English (AI)
#Above the condition rows there is a Describe your rule box. Type what you want in your own words — for example buy when RSI 14 crosses below 30 on 5 minute — and press Build rule. The conditions below are filled in for you.
It fills the form, it does not save anything. Read the In plain words sentence it produces, check it says what you meant, then set your legs and risk values and press Save yourself. Nothing goes live until you do.
Every fill can be undone. An Undo link appears after a build and puts your previous rules back, so trying it never costs you work.
It sets conditions only — never lots, stop loss, target, expiry or broker. If your sentence mentions those, it builds the conditions and lists what you still need to set yourself.
It will not choose the value you are comparing against. If you say when RSI is low without a number, it asks you for the number instead of guessing one. It also cannot design a strategy for you — asking it for a profitable setup will be refused. That is deliberate: the levels in your strategy must be yours.
It will fill in ordinary settings you did not mention — the timeframe, or an indicator's period — using the same defaults the form itself uses, and it tells you which ones it used so you can change them. For example 60 moving average crosses below candle close builds on 5 minute and says so.
There is no time-of-day condition. If you want to trade at a particular clock time, set it in the signal's own start and end time fields, not here.
There is a daily limit on how many rules you can build this way, and the box always shows how many are left. You can try it without logging in. Free tries are limited in two ways — a small number per person per day, and a larger number shared by all visitors together — so they can run out during the day. Logged-in clients get their own separate daily allowance, which nobody else can use up.
Levels — opening range, pivots, Camarilla, CPR
#Choose Level on either side of a condition to compare price against a horizontal reference level instead of an indicator.
A level is different from an indicator: an indicator is calculated from the last few candles as they roll forward, while a level is fixed for the day — today's opening range, or yesterday's pivots.
Available levels: Opening range (breakout), Previous day (high/low/open/close), Pivot points (Classic) with P and R1–R3 / S1–S3, Pivot points (Fibonacci), Pivot points (Woodie), CPR (Central Pivot Range) with P, TC and BC, and Camarilla levels H1–H4 / L1–L4.
Levels can carry a +/- margin like any other condition side, so Pivot R1 + 0.1% is a valid comparison.
All the daily levels are calculated from the last completed trading day, exactly as your broker chart shows them. They are not available until at least one full previous day of data exists.
Opening range breakout
#The Opening range (breakout) level watches a window at the start of the day — by default 09:15 to 10:15 — and gives you its Range high, Range low, Range middle and Range width. Both times are editable, so 09:30 to 10:30 (or any other window) works the same way.
A long breakout entry is one row: candle close is above Opening range (breakout) Range high. For the short side, use candle close is below Range low in the Sell block. To trade the reversal instead, simply swap which side each block uses.
The range is not usable until its window has finished. A candle inside the window is part of the range being built, so it can never trigger a breakout. The first candle that can break the range is the one starting at your To time.
Useful additions: set Max entries per day to 1 to take only the first breakout of the day; add a small margin such as + 0.05% so a single tick touching the level is not enough; and use Range width in a second condition to skip days where the opening range is unusually wide.
The range is measured on one-minute candles, so it is exactly the same whichever timeframe your conditions use.
Candle patterns
#Set the first dropdown of a rule to Candle pattern for a ready-made candle rule, with no indicator needed. Then pick the pattern, the candle it applies to, and the timeframe.
Available patterns: Bullish (green) candle, Bearish (red) candle, Higher high, Lower high, Higher low, Lower low, Inside bar, Outside bar, Bullish engulfing, Bearish engulfing, Doji, Gap up, Gap down, Green candles in a row, and Red candles in a row.
Each row also has an is / is not dropdown, so you can require a pattern or require its absence.
Green/Red candles in a row takes a count (2 to 10). Doji takes how small the body must be as a share of the candle range (default 10%).
Patterns mix freely with indicator rows in the same AND / OR block. Example: the candle on 5m is Bullish engulfing AND RSI (14) on 5m is below 40.
Timeframes
#Conditions can be evaluated on 1m, 3m, 5m, 15m, 1h, or 1d candles, and different conditions in one strategy can use different timeframes.
The strategy is checked whenever the smallest timeframe you used closes a candle. Example: a strategy with 5m and 15m conditions is checked at every 5-minute close.
State vs crossing conditions
#State conditions — is above, is below, at or above, at or below — are true on every candle while the state holds. They are the safest choice for exits.
Crossing conditions — crosses above, crosses below — are true only on the exact candle where the cross happens. They are the usual choice for entries.
Example: RSI crosses below 30 fires once at the moment RSI drops through 30. RSI is below 30 stays true on every candle while RSI remains under 30.
RSI
#RSI (Relative Strength Index) measures overbought and oversold zones on a 0–100 scale. Configure the period (default 14).
Example entry: RSI (14) crosses below 30 on 5m to buy a dip. Example exit: RSI (14) at or above 60.
EMA / SMA / WMA
#Moving averages smooth the price. EMA reacts faster, SMA is the simple average, WMA weights recent candles more. Configure the period.
Example: EMA (9) crosses above EMA (21) on 15m is a classic trend-following entry, with the opposite cross as the exit.
MACD
#MACD is a momentum indicator with three outputs: the MACD line, the Signal line, and the Histogram.
Example: MACD line crosses above Signal line for a bullish entry, or Histogram is above 0 as a trend filter.
Supertrend, Bollinger, ADX, Stochastic, ATR
#Supertrend gives a trend line below or above price; its Direction output is +1 in an uptrend and -1 in a downtrend, so "Direction is above 0" means the trend is up.
Bollinger Bands give an upper, middle, and lower band. ADX measures trend strength with +DI and -DI direction lines. Stochastic gives %K and %D. ATR measures volatility.
Every indicator and its settings appear in the same dropdown builder — no coding is ever needed.
The full indicator list
#The indicator dropdown is grouped so it stays easy to scan: Trend — SMA, EMA, WMA, HMA (Hull), Supertrend, Parabolic SAR, ADX. Momentum — RSI, MACD, Stochastic, CCI, Williams %R, ROC. Volatility — ATR, Bollinger Bands, Donchian Channels, Keltner Channels. Volume — VWAP, OBV, MFI.
VWAP is the volume weighted average price for the day and resets every morning. Parabolic SAR gives a trailing stop level plus a Direction output (+1 up, -1 down) like Supertrend. Donchian and Keltner give upper/middle/lower bands, like Bollinger but calculated differently. HMA is a faster-reacting moving average. CCI, Williams %R and ROC are momentum readings. OBV and MFI use volume to confirm a move.
Volume-based indicators (VWAP, OBV, MFI) are calculated on the futures series, because an index itself has no volume. For VWAP this matters: futures trade a little away from the index, so a VWAP comparison only makes sense on a futures strategy. If you use VWAP, set Reference Price to Futures — the platform will ask you to do this when you save.
Entry and exit conditions
#Entry conditions open a position. Exit conditions close it. Exit conditions are optional — your risk controls (stop loss, target, trailing) and the signal end time always protect the position as well.
Indicator exits are checked with the same candle rules as entries. Prefer state conditions (is above / is below) for exits so a brief data revision can never skip your exit.
Official candle close
#Conditions are evaluated a few seconds after each official candle close, on the same candle values your broker chart shows. Values inside a running candle never fire a signal.
A decision is final once made: revised candle data never re-fires or un-fires a past signal, and the platform never trades a stale candle after a restart.
Max entries per day
#Max entries per day caps how many entry attempts the strategy can make in one trading day (1 to 20).
Every matched candle is one attempt, and attempts rejected by the broker also count toward the cap. Example: with a cap of 2, after two attempts the strategy waits for the next day.
Re-entry cooldown
#Re-entry cooldown is a waiting time in seconds after an entry before the next entry is allowed (up to 3600).
Use it to stop a fast timeframe from re-entering immediately after an exit.
Signal time window and weekdays
#The signal start and end time limit when entries can fire, and Active Weekdays limits which days the strategy runs.
The end time is required — it is also the square-off time that closes any open position.
Execution legs
#The Execution section defines what is traded when a signal fires — the same leg builder used by Trade Bridge and Trade Bots.
For example, one BUY option leg turns a bullish indicator signal into a call purchase.
Strike Selection
#Strike Selection decides which option strike is chosen when the signal fires.
ATM is usually easiest for beginners. ITM/OTM offsets, closest premium, and delta-based selection are also available.
Product MIS / NRML
#MIS is normally for intraday trading where the broker supports it.
NRML is for positional/carry-forward style trading where supported.
Stop Loss
#Common example: You BUY one option at entry price Rs 100. Quantity is 1. Initial Stop Loss is Rs 90 unless the section says otherwise.
If Stop Loss type is Points and value is 10, the stop loss is Rs 90. That means if the option falls from Rs 100 to Rs 90, the system tries to exit to limit the loss.
If Stop Loss type is Percent and value is 10, the stop loss is also Rs 90 because 10% of Rs 100 is Rs 10.
If Stop Loss type is MTM and value is 10 with quantity 1, the system watches for Rs 10 total loss. With entry Rs 100, that is the same as price falling to Rs 90 in this simple quantity-1 example.
When Stop Loss is placed as a broker-terminal SL-L order, the default trigger-to-limit buffer is 19%.
Target
#Common example: You BUY one option at entry price Rs 100. Quantity is 1. Initial Stop Loss is Rs 90 unless the section says otherwise.
If Target type is Points and value is 30, the target is Rs 130. That means if the option rises from Rs 100 to Rs 130, the system tries to book profit.
If Target type is Percent and value is 30, the target is also Rs 130 because 30% of Rs 100 is Rs 30.
If Target type is MTM and value is 30 with quantity 1, the system watches for Rs 30 total profit. With entry Rs 100, that is the same as price reaching Rs 130 in this simple quantity-1 example.
Trailing Stop Loss
#Trailing Stop Loss moves the stop loss upward as a BUY trade moves in profit. It does not move the stop loss down when price falls.
Example: You BUY one option at Rs 100 with initial SL at Rs 90. Trail Every X is 10 points and Trail By Y is 5 points.
When price reaches Rs 110, the trade has moved 10 points in profit, so SL trails by 5 points: SL moves from Rs 90 to Rs 95.
When price reaches Rs 120, the trade has moved another 10 points in profit, so SL trails by another 5 points: SL moves from Rs 95 to Rs 100.
When price reaches Rs 130, SL can move to Rs 105, and so on. This protects more profit step by step while the trade continues.
Trail To Cost
#Trail To Cost, or T2C, moves stop loss to your entry price after the trade gives enough profit.
Example: You BUY one option at Rs 100 with initial SL at Rs 90. T2C trigger is 20 points.
If price moves only to Rs 110, T2C does not activate because profit is only 10 points.
When price reaches Rs 120, profit is 20 points, so T2C activates and SL can move from Rs 90 to Rs 100.
After this, if price falls back to Rs 100, the trade is protected at cost instead of taking the original Rs 10 loss.
Wait and Trade
#Wait and Trade tells a leg not to enter the moment the signal comes. It waits until the price moves by the amount you set, and enters then.
The number is a price direction, not a profit direction. A plus number waits for a higher price and a minus number waits for a lower price, and it reads the same whether your leg buys or sells.
Example: the signal comes when the option is at Rs 100 and you set Wait and Trade 2 Points. The leg does not enter at Rs 100. It waits until the price is Rs 102 or more, and enters there.
Example with a minus: the same signal with Wait and Trade -2 Points enters when the price falls to Rs 98 or lower.
You can also use % instead of Points. On a Rs 100 option, 5% waits for Rs 105 and -5% waits for Rs 95.
If the price never reaches your level, no order is placed at all. The wait ends at that leg Auto Exit Time, and the order shows as cancelled with the reason.
While a leg is waiting, the dashboard shows Waiting to enter, and nothing is sent to your broker until the price arrives.

After Stop Loss: Re-Entry and Re-Execute
#After Stop Loss decides what a leg does once its stop loss is hit. There are three choices: Do nothing, Re-Entry, and Re-Execute.
Re-Entry waits for the price to come back to your original entry price and enters the SAME strike again. Example: you BUY at Rs 100 and your stop loss takes you out at Rs 90. The leg then waits, and only when the price climbs back to Rs 100 or higher does it buy that same strike again. If the leg SOLD at Rs 100 and was stopped out at Rs 110, it waits for the price to come back down to Rs 100 or lower.
Re-Execute does not wait. It enters again straight away, and it picks the strike using your leg settings at that moment. So an ATM leg takes whatever is ATM now, which is usually a DIFFERENT strike from the one that was stopped out. That is the point of it.
How many times is the number of EXTRA entries after the first one. If you set 3, the leg can enter up to 3 more times in the day, so up to 4 entries in total. You can set up to 100.
Think about the number before you set a big one, especially with Re-Execute. Every attempt is a real order at your broker, with the brokerage and charges that go with it, and Re-Execute goes back in the moment the stop loss is hit rather than waiting for anything. On a choppy day a high number can mean a great many orders.
Both of them run your whole leg setup again, including Wait and Trade, stop loss, target, trailing stop and Auto Exit Time. It is not just buying again; it is running that leg again.
Only a plain stop loss starts this. If the leg was closed by a trailing stop, by Trail To Cost, by its target, by Auto Exit Time, or by you exiting manually, nothing re-enters.
The count resets every day, and anything still waiting is dropped at that leg Auto Exit Time. While a leg is waiting to go back in, the dashboard shows Waiting to re-enter with the attempt number.
Your position stays in the same trade. A re-entry is not a new signal, so it does not need a new alert and does not use a new position slot.
In Trade Builder there is one more thing to know: a re-entry does NOT use up your Max entries per day. That limit counts the entries your indicator conditions produce. Going back in after a stop loss is part of the same trade, so it is not counted as another signal.
See your strategy on a chart
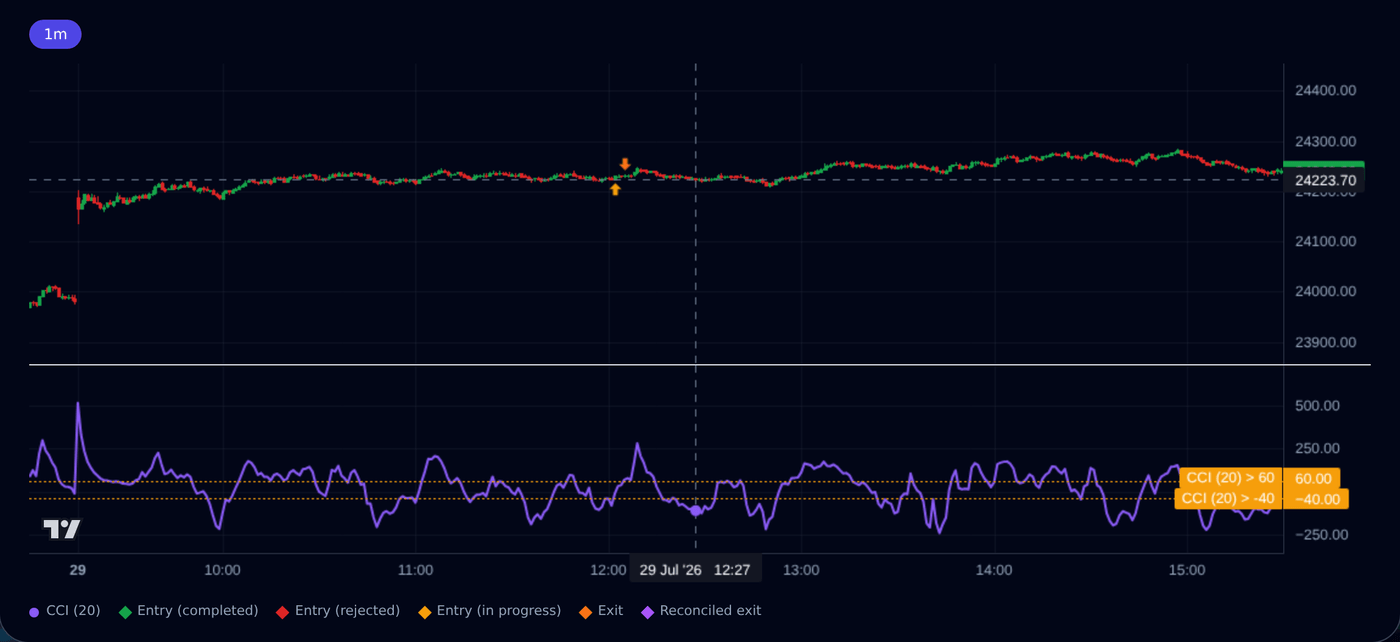
#Every active strategy has a chart icon on the Strategies page and next to its name on the Dashboard.
Click it to open a candle chart with exactly your strategy's indicators drawn on it: moving averages on the price, oscillators such as RSI in their own panels, dashed lines at the levels you used (for example RSI 30), and arrows where the strategy actually entered and exited.
The chart shows the timeframes your conditions use, follows light and dark theme, works on mobile, and refreshes every minute while open — with a refresh button for an instant update.
Common BUY example used in docs
#Use this same simple example while reading risk fields: BUY one option at Rs 100, quantity 1, initial SL Rs 90.
Stop Loss 10 points means exit at Rs 90 if the price falls.
Target 30 points means book profit at Rs 130 if the price rises.
Trailing Stop Loss with X 10 and Y 5 means SL moves from Rs 90 to Rs 95 at price Rs 110, then to Rs 100 at price Rs 120, then to Rs 105 at price Rs 130.
Trail To Cost 20 points means SL moves to the entry price Rs 100 only after price reaches Rs 120.