Common Platform
Analytics
Detailed guide for reading performance metrics, filters, summary charts, trade details, pagination, and CSV export.
Overview
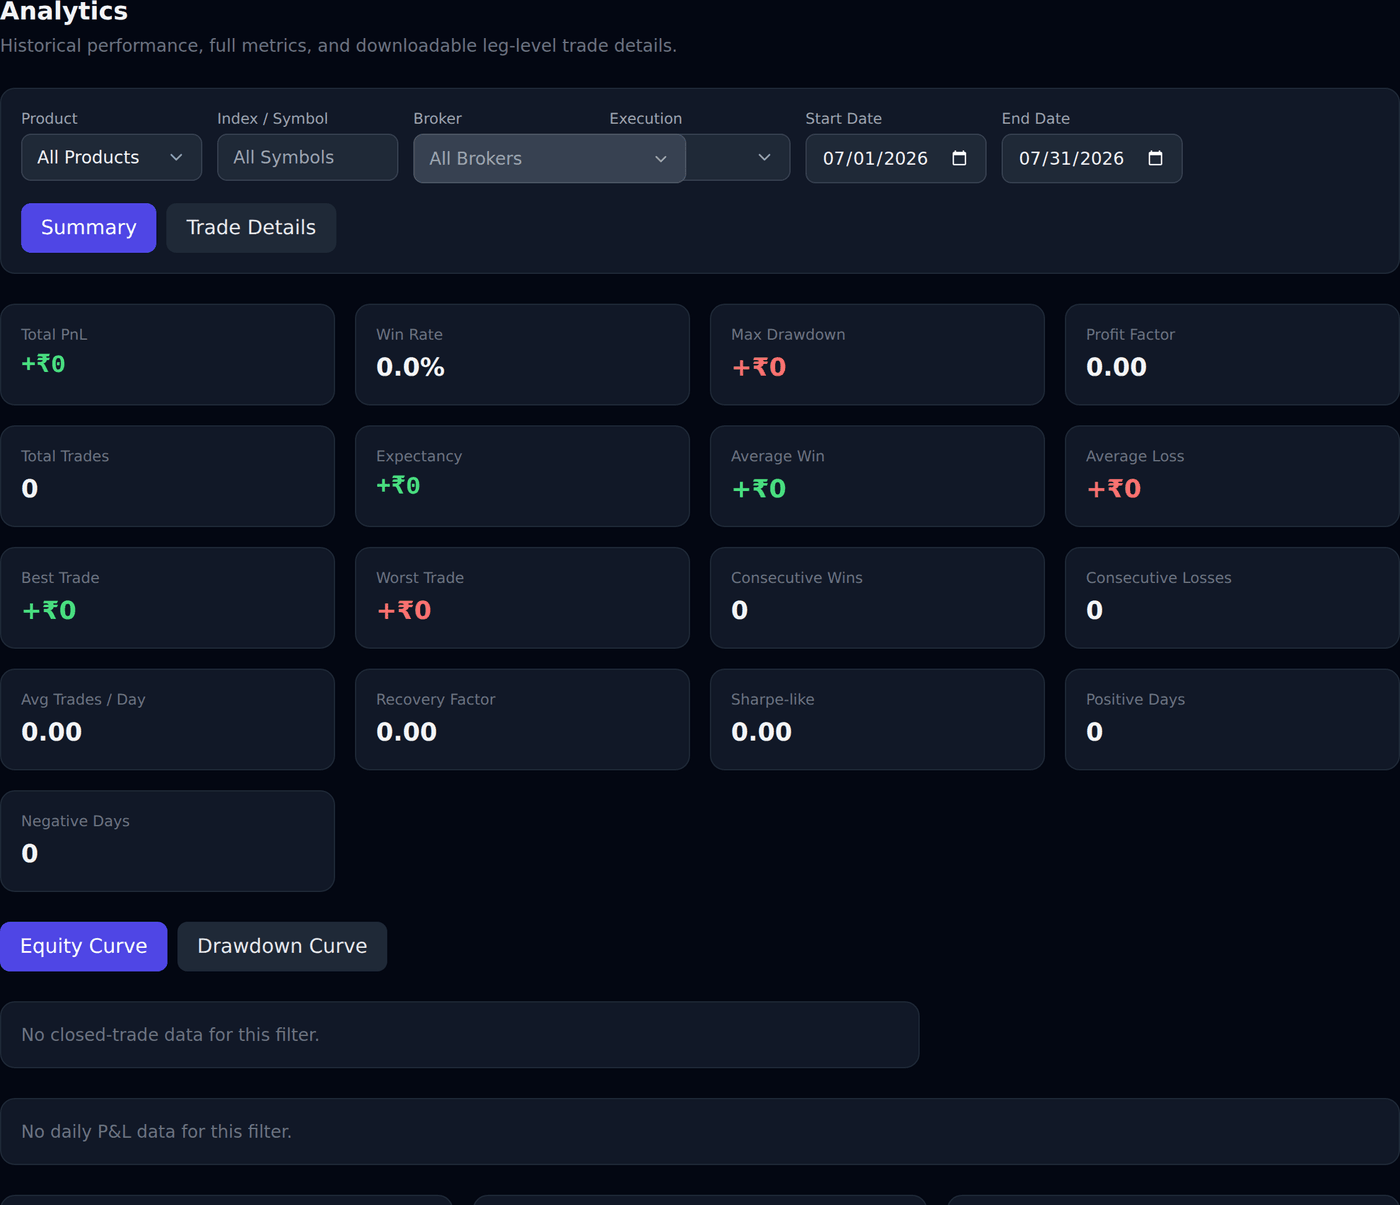
#Analytics helps review historical performance, full metrics, and downloadable leg-level trade details.
The current Analytics page supports All Products, Trade Bridge, Trade Bots, Trade Builder, Trade Scalper, and Equity Rebalancer. Trade Disc trades are recorded in Orders and Positions; a Trade Disc filter on Analytics is not available yet.
Product filter
#Product can be All Products, Trade Bridge, Trade Bots, Trade Builder, Trade Scalper, or Equity Rebalancer.
When you open Analytics from an app menu, the page may already select that product using the URL, for example /analytics?product=trade_bridge. Change Product when you want to compare apps.
Default date range
#By default, Analytics starts with approximately the last 30 days and ends today.
Use Start Date and End Date to narrow or expand the report. Example: To check only today’s result, set both dates to today’s date.
Strategy Name filter
#Strategy Name appears only for automation products such as Trade Bridge, Trade Bots, and Trade Builder.
Choose one strategy when you want to review only that strategy. When Product is All Products, Trade Scalper, or Equity Rebalancer, this dropdown is not shown.
Signal filter
#Signal appears after choosing a strategy in Trade Bridge, Trade Bots, or Trade Builder.
For Trade Bridge and Trade Builder, signals can be Long or Short style signals. For Trade Bots, the signal is the bot’s scheduled signal.
Index / Symbol filter
#Index / Symbol filters trades by symbol.
For Trade Scalper and All Products, this is a text box where you can type a symbol such as NIFTY. For Trade Bridge, Trade Bots, and Trade Builder, it is a dropdown built from symbols in saved strategies.
Broker filter
#Broker filter separates performance by broker account.
Use it if more than one broker account is assigned. Example: Select your account to ignore trades from or .
Execution filter
#Execution filter can be All, Live, or Forward Testing.
Use Live when reviewing broker-traded results. Use Forward Testing when reviewing Forward Testing rows where supported.
Summary and Trade Details tabs
#Summary shows metrics, charts, and breakdowns.
Trade Details shows row-by-row trade/leg records, sorting controls, page size, pagination, and CSV download.
Demo preview
#When logged out and preview is supported, Analytics can show demo rows for Trade Bridge and Trade Bots.
Demo analytics is for learning the report only. It is not your real trading history.
Total PnL
#Total PnL is the total profit or loss for selected filters.
Simple example: One BUY trade entered at Rs 100 and exited at Rs 130 gives Rs 30 profit for Qty 1. Another trade loses Rs 10. Total PnL becomes Rs 20 before charges.
Win Rate
#Win Rate is the percentage of trades that closed in profit.
Example: If 6 out of 10 trades are profitable, Win Rate is 60%. A high Win Rate is not enough by itself; one large loss can still reduce Total PnL.
Max Drawdown
#Max Drawdown shows the largest fall from a previous high point in the selected period.
Example: If your running profit reached Rs 5,000 and later dropped to Rs 3,500, drawdown from that peak is Rs 1,500.
Profit Factor
#Profit Factor compares total profit from winning trades with total loss from losing trades.
Example: If winners made Rs 3,000 and losers lost Rs 1,500, Profit Factor is 2.00. Above 1 means gross profit is higher than gross loss.
Total Trades
#Total Trades is the number of trades included in the selected report.
A trade can contain multiple legs in automation tools. Trade Details gives the row-level/leg-level view.
Expectancy
#Expectancy is the average expected result per trade from the selected data.
Example: If 10 trades together made Rs 1,000, expectancy is about Rs 100 per trade before charges.
Average Win and Average Loss
#Average Win is the average profit from winning trades. Average Loss is the average loss from losing trades.
Example: If 5 winners made total Rs 2,500, Average Win is Rs 500. If 5 losers lost total Rs 1,500, Average Loss is Rs 300.
Best Trade and Worst Trade
#Best Trade is the largest profit trade. Worst Trade is the largest loss trade in the selected data.
Use these to check whether one unusual trade is heavily affecting the report.
Consecutive Wins and Losses
#Consecutive Wins shows the longest winning streak. Consecutive Losses shows the longest losing streak.
Example: If you had loss, loss, loss, then profit, the consecutive loss count is 3.
Avg Trades / Day
#Avg Trades / Day tells how frequently the selected strategy or product traded.
If this is unexpectedly high, check whether duplicate signals or repeated manual actions happened.
Recovery Factor and Sharpe-like
#Recovery Factor and Sharpe-like are performance quality measures.
Beginners can read them as comparison numbers. Higher is usually better, but always review actual trades, drawdown, and risk before judging a strategy.
Positive Days and Negative Days
#Positive Days counts days where total P&L was positive. Negative Days counts days where total P&L was negative.
Example: If a strategy traded for 10 days and 7 days closed positive, Positive Days is 7.
Long / Short metrics
#Long Win Rate, Short Win Rate, Long Trades, and Short Trades appear for Trade Bridge and Trade Builder because they have Long and Short signal directions.
Use these to see whether one signal side is weaker. Example: Long Win Rate 70% and Short Win Rate 35% means short-side logic needs review.
Equity Curve
#Equity Curve shows cumulative P&L over time.
If the line generally rises, the selected trades made money overall. If it falls, the selected trades lost money overall.
Drawdown Curve
#Drawdown Curve shows how much the report fell from the previous high point.
A deep drawdown means the account had a large fall from its best point during that period.
Daily P&L bars
#Daily P&L bars show profit or loss day by day.
Use this to quickly find the day where a large profit or loss happened.
Daily P&L Calendar
#Daily P&L Calendar shows daily performance in a calendar-style view.
It helps beginners see whether profits/losses are spread out or concentrated on a few days.
Breakdown tables
#Breakdown tables summarize results by Product, Strategy, Symbol, and Broker depending on selected Product.
By Product appears only for All Products. By Strategy appears for Trade Bridge, Trade Bots, and Trade Builder. Symbol and Broker breakdowns appear for product views where data exists.
Download Trade Details
#Download Trade Details creates a CSV file for offline review.
Analytics CSV exports include support references such as Trade Ref, Leg Ref, Order Ref, and Broker Order ID where available. Do not share CSV publicly because it can include trade history, broker references, and P&L.
Rows per page
#Rows lets you choose 25, 50, or 100 rows per page.
Use 25 when reading carefully. Use 100 when scanning many trades.
Previous and Next
#The bottom area shows how many rows are visible and total rows.
Use Previous and Next to move between pages. If no rows match selected filters, the table says No trade details found for the selected filters.
Product
#Product shows which app created the row, such as TradeBridge, TradeBots, or TradeScalper.
Use Product first when All Products is selected.
Entry Time
#Entry Time shows when the trade entered, using IST with seconds.
Use this to compare with charts, broker order book, or webhook/signal timing.
Trade Ref, Leg Ref, Order Ref, and Broker Order ID
#Analytics is the client-facing place for full investigation references: Trade Ref identifies the trade/execution, Leg Ref identifies the specific leg where available, Order Ref identifies the platform order row, and Broker Order ID is returned by the broker when available.
Use these references with support instead of sending private credentials.
Strategy and Signal
#Strategy shows the strategy name for automation tools. Signal shows Long/Short, SIGNAL for Trade Bots, or Manual for Trade Scalper.
Example: Trade Bridge Long means the long-side signal created the trade. Trade Scalper Manual means the trader placed it manually.
Symbol, Broker, Leg, and Side
#Symbol shows the traded instrument, Broker shows the account label, Leg shows leg name if available, and Side shows BUY or SELL.
Common example: Symbol NIFTY option, Side BUY, Qty 1, Entry Rs 100 means one buy-side option entry was recorded around Rs 100.
Qty, Entry, Exit, and PnL
#Qty is traded quantity. Entry and Exit are prices. PnL is the result for that row.
Simple BUY example: Qty 1, Entry Rs 100, Exit Rs 130 means about Rs 30 profit before charges. Entry Rs 100, Exit Rs 90 means about Rs 10 loss.
Status and Exit Reason
#Status tells whether the trade row is closed, active, error, or another stored status.
Exit Reason explains why it closed, such as SL Hit, Target Hit, T2C Hit, Manual Exit, or broker/platform failure reason where available.
Compare with Orders
#If a result looks wrong, compare Analytics with the Orders page.
Orders show what was sent to the broker and the broker status. Analytics summarizes trade outcome.
Compare with Positions
#If a trade is still running, it may be visible in Positions instead of Analytics.
Analytics is most useful after the trade is closed or when historical rows are available.
Investigate a loss
#When reviewing a loss, check entry time, exit time, SL/target settings, order rejection messages, and whether the strategy followed the intended plan.
A loss is not always a platform issue. It can also happen because market moved, SL triggered correctly, or broker filled at a worse price during fast movement.
Charges note
#Analytics P&L may not include all broker charges, exchange charges, taxes, and slippage unless explicitly shown.
Use broker contract notes for final official accounting.