Discretionary Trading Tools
Trade Charts: Getting Started
Trade options from the chart itself — entry, stop loss and target are lines you drag.
Trade options by pointing at the chart
#Trade Charts is discretionary, like Trade Scalper and Trade Disc. Nothing is automated — you decide every entry and every exit. What is different is where you do it: on the candles themselves.
Your entry, your stop loss and your target are lines on the chart. To move a stop, you drag its line — with the mouse, or with a finger on a phone. To place an order, you press Buy or Sell above the chart, or right-click on the chart itself.
You can watch up to four charts side by side: the index on one, its call and its put on the others. Each chart can show chart patterns, candlestick patterns, trend lines, any of the indicators you choose, and lines you draw yourself.
Which tool is this, and how is it different?
#Bluechip Algos has seven trading tools. Three place trades from a signal, three are for trading by hand, and one manages a stock portfolio. The quickest way to tell them apart is to ask what decides the entry.
- Trade Scalper — you decide, trade by trade. A discretionary tool for intraday traders and scalpers, with advanced controls built for option traders.
- Trade Disc — you decide, and then you adjust. A discretionary terminal for option traders who change a position after it is open — moving a leg to another strike, or changing its size, in one click.
- Trade Charts (this one) — you decide, on the chart. Options traded straight from the candles — entry, stop loss and target are lines you drag, with patterns and indicators drawn on the same chart.
- Trade Builder — indicators decide. RSI, moving averages, Supertrend, levels and candle patterns, worked out inside the platform on official candles. It analyses the index and places the order in options.
- Trade Bots — the clock decides. You give it times — enter at 09:20, exit at 15:10, on these weekdays. Straddles and strangles built around a schedule rather than an indicator.
- Trade Bridge — somebody else decides. Your signal comes from a third party such as TradingView. You configure what to trade here in Trade Apps, and the order is executed in your broker terminal.
- Equity Rebalancer — your stock list decides, on your schedule. You hold a fixed number of stocks in equal amounts and change the list every week or month. It works out what to sell and buy so every stock is even again, and buys shares for delivery rather than trading intraday.
Who this suits, and who it does not?
#It suits option traders who read the chart first and want the order, the stop and the target in the same place they are looking — without copying a price from the chart into a form.
It suits you if you like to set a stop at a level you can see, such as just under the last swing low, and move it by hand as the trade goes on.
It does not suit you if you trade from the option chain and think in strikes rather than in candles. Trade Scalper and Trade Disc are built around the chain and stay the better screens for that.
It does not trade stocks or stock options. Only index options (NIFTY, BANKNIFTY, SENSEX) and commodity options, plus a view-only chart of their underlying.
What you need before you start?
#Four things. The second one is the one people miss.
- An active subscription for Trade Charts and at least one connected broker account.
- The accounts you want to trade ticked in Configuration. Until one is ticked the page says No account selected — orders cannot be placed until you choose at least one. See Configuration.
- A look at the mode switch at the top left. Forward Testing and Live look the same apart from the colour; only that switch decides whether real money moves.
- An understanding of options. This screen assumes you already know what buying a call does and what a stop loss is for.
What is on the screen?
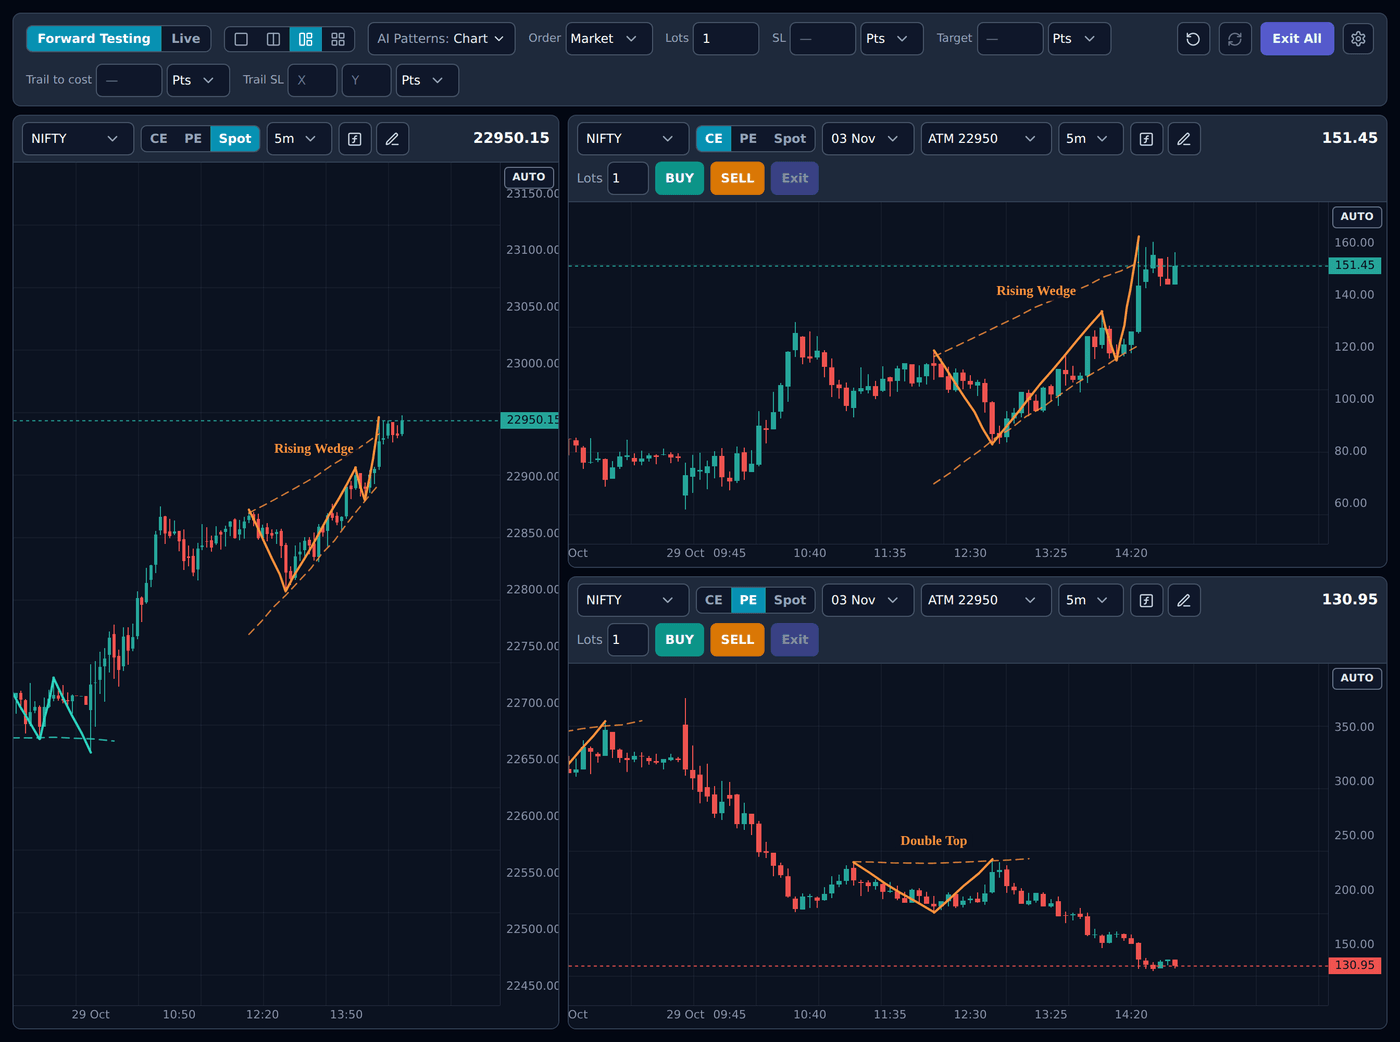
#At the top is the common bar — the settings that apply to every chart: the mode, the layout, the Patterns menu, the order type, lots, SL, Target, Trail to cost and Trail SL, then the Reset icon, the Update-all button, Exit All and the Configuration gear.
Below it are the charts. When you open Trade Charts for the first time you see three: the NIFTY index on the left, and the NIFTY ATM call and ATM put stacked on the right. So if NIFTY is at 24,250, the right-hand charts show the 24,250 CE and the 24,250 PE.
The four square buttons in the common bar switch between 1, 2, 3 or 4 charts. Every layout remembers its own charts, so switching to four and back to three does not lose what you set up.
- 1 chart — the NIFTY index.
- 2 charts — the NIFTY ATM call and ATM put, side by side.
- 3 charts — the index on the left, its ATM call and put on the right. This is the default.
- 4 charts — the NIFTY and SENSEX indices on top, the NIFTY ATM call and put below.
Choosing what a chart shows
#Every chart has its own header, and every chart can show something different. From left to right:
Each chart always loads the last 1000 candles of the timeframe you pick. On 5 minutes that is roughly thirteen trading days; on 1 day it is about four years.
- Underlying — NIFTY, BANKNIFTY, SENSEX, or a commodity such as CRUDEOIL.
- CE / PE / Spot — the call, the put, or the underlying itself. For a commodity the third button reads FUT, the nearest future, because a commodity has no spot you can trade. An underlying chart is for viewing only — it has no Buy and Sell.
- Expiry — which weekly or monthly contract.
- Strike — shown as ATM 24250, 2 OTM 24350, 1 ITM 24200 and so on. You can switch this to plain strike prices in Configuration.
- Timeframe — 1m, 3m, 5m, 15m, 1h or 1d.
- Two small icons — indicators and the trend-line pen. See Patterns, indicators and drawing.
- On an option chart, Lots, BUY, SELL and Exit for that chart. The live price sits at the far right of the header.
Your first trade, step by step
#Let us walk through one trade with real numbers. NIFTY is at 24,250. You want to buy one lot of the 24,250 CE, which is trading at Rs 100. You want a stop 10 points below and a target 20 points above.
1. Check the mode switch says Forward Testing while you are learning.
2. In the common bar, type 10 in SL and 20 in Target, both with Pts beside them. Leave Order on Market.
3. On the 24,250 CE chart, press BUY. The order goes out for one lot (65 quantity).
4. Three things appear on the right of that chart: a blue B tag at Rs 100 showing the quantity and the running P&L, a red SL line at Rs 90, and a green TP line at Rs 120.
5. The price moves up to Rs 108 and you want to protect more. Press on the red SL line and drag it up to Rs 98. When you let go, the stop is saved at Rs 98. Your broker’s protective order, if you keep one there, moves with it.
6. To leave early, press the small × on the position tag, or right-click the tag and choose Exit.
Everything else — the other kinds of stop, trail to cost, trailing SL, limit orders and the chart menu — is on Trading from the chart.
On a phone
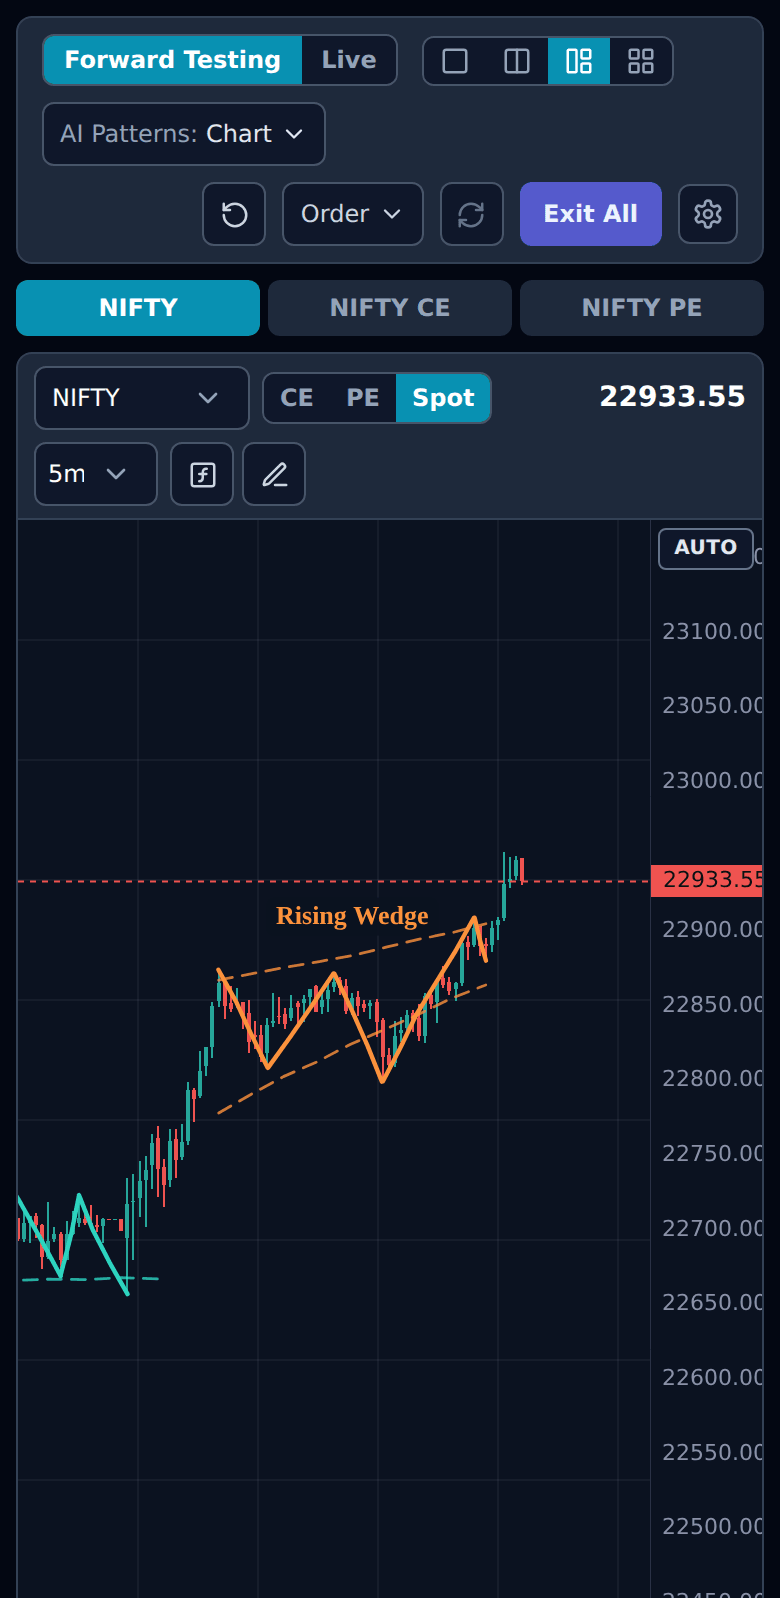
#On a phone you see one chart at a time. Tabs above it — for example NIFTY, NIFTY CE, NIFTY PE — switch between the charts of the layout you chose.
The order settings of the common bar fold away behind an Order button so the chart gets the screen. Tap it to open them.
There is no right-click on a phone. Hold your finger still on the chart for about half a second instead, and the same menu opens. Dragging a line works with your finger exactly as it does with a mouse.
Looking around before you log in
#You can open Trade Charts without logging in. You see the same screen with real charts from the last close, and you can change symbols, timeframes, patterns and indicators to see how it works.
Nothing is live and nothing is saved, and every trading button answers Please login and connect to a broker to trade.
What it cannot do?
#So there are no surprises later:
- It does not trade stocks, stock options or plain futures. Only index and commodity options.
- It does not place orders from a pattern or an indicator. Patterns and indicators are for your eyes; you press every button.
- It never changes the strike of a chart by itself. When the market moves it offers you Update, and waits.
- It never fills in a limit price for you. A limit price is always the number you type.
- It shows 1000 candles and no more. Scrolling further back does not load older history.
- It is on the web only. There is no desktop version.
If something does not work
#Check these in order. The first one is the most common.
- Buy and Sell do nothing, or say no account is selected — tick at least one broker account in Configuration.
- There is no Buy or Sell on a chart — that chart shows the underlying (Spot or FUT). Switch it to CE or PE.
- It says Please login and connect to a broker to trade — you are in the logged-out preview. Log in.
- A line jumps back after you drag it — the new level was on the wrong side of the market. A bought option’s stop must stay below the current price and its target above it.
- The chart moved away from the latest candles, or looks squashed — press AUTO at the top of the price scale.
- An amber strip says ATM is now … — the market has moved since you opened that strike. See When ATM moves.