Strategy Automation Tools
Build Your First Strategy
One complete strategy built from start to finish, with real numbers and a picture of every step.
Build your first strategy
#This page builds one complete strategy from start to finish. It is deliberately the simplest useful one: buy a NIFTY call option when RSI falls below 30 on the 5-minute chart.
Follow it exactly once. After that, changing it to your own idea is only a matter of changing the dropdowns.
Keep the Mode on Forward Testing the whole way through. Nothing here will place a real order.
Step 1 — Open the form
#Go to Trading Tools, open Trade Builder, and click New strategy.
Give it a name you will recognise later, such as NIFTY RSI dip test. The name is only for you — it changes nothing about how the strategy behaves.
Step 2 — Choose what to trade
#Set Symbol to NIFTY.
Leave Reference Price on Spot and Trade Type on Intraday for now. Spot means the rule reads the index itself, and Intraday means the position is closed the same day.
Step 3 — Build the rule
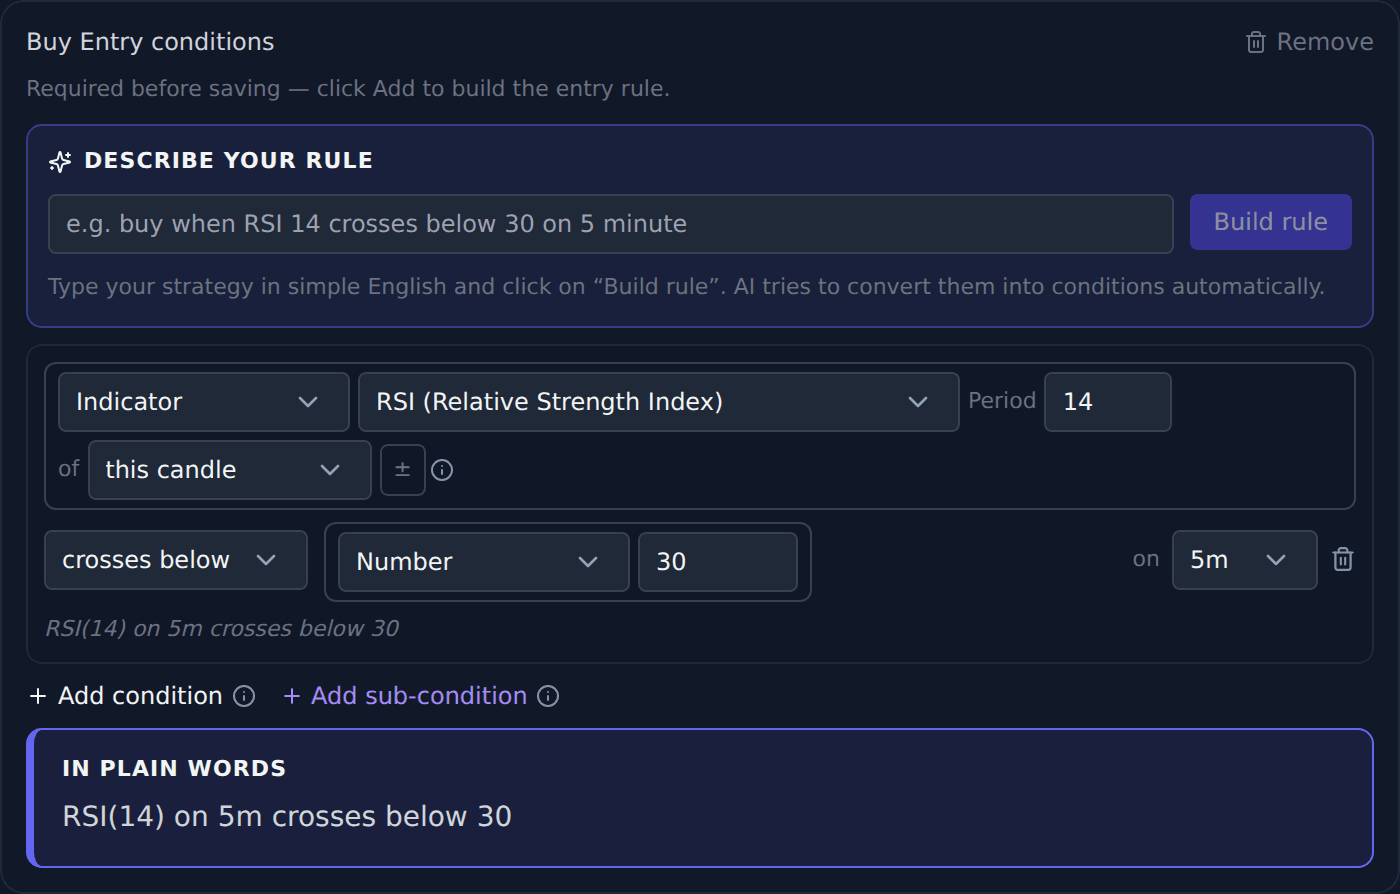
#Click Add buy entry, then Add condition. Set the row to read: Indicator → RSI (Relative Strength Index), period 14, crosses below, Number, 30, on 5m.
Now read the grey line underneath. It says RSI(14) on 5m crosses below 30. That is your whole rule in one sentence.
Always read that line before saving. It is the single best check you have. If it does not say what you meant, the dropdowns are wrong.
Step 4 — Say what to buy
#The rule decides when. The leg decides what.
Set Type to CE (a call option), Side to BUY, Expiry to Current Weekly, and Strike Selection to ATM / ITM / OTM with an offset of 0 — which means the strike nearest the current price.
Set Lots to 1 while you are testing. You can raise it once you trust the strategy.
Step 5 — Set your exit
#A strategy that can enter but never exit is not finished.
Set a Stop Loss and a Target on the leg. As an example, a stop loss of 20% and a target of 40% mean: if the option you bought at Rs 100 falls to Rs 80 the platform exits, and if it rises to Rs 140 it exits.
Also set Auto Exit Time — usually 15:15 — so an intraday position never gets left open into the close.
These numbers are examples to show how the fields work. What you actually use is your decision.
Step 6 — Save and watch
#Click Save. The strategy appears in your list, switched off.
Turn it on. From that moment the platform checks your rule at the close of every 5-minute candle, during market hours only.
Nothing may happen for hours, or all day. That is normal — RSI below 30 is not an everyday event. Silence means the condition has not been true, not that something is broken.
Step 7 — See what it saw
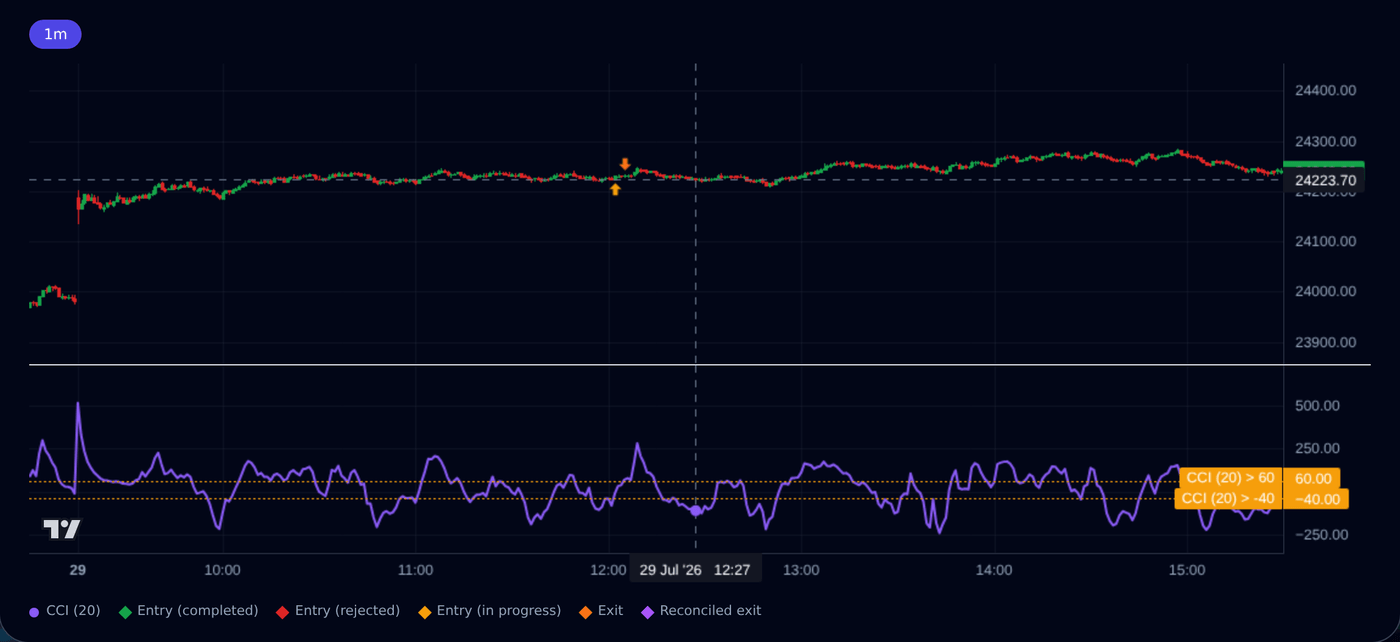
#Open Chart View from the strategy. It draws the candles with your indicator underneath, so you can see exactly where the condition became true and where it did not.
This is the fastest way to answer "why did it not enter?". Nine times out of ten the chart shows the value came close but never actually crossed your level.