Discretionary Trading Tools
Trade Charts: Patterns, Indicators and Drawing
Chart patterns, candlestick patterns, trend lines and swing levels, indicators with your own values, and the trend-line pen.
What the chart can draw for you?
#Trade Charts can mark three kinds of pattern on your candles, add any of about a hundred indicators, and let you draw your own trend lines.
None of this places an order. It is there to help you read the chart. A pattern is a picture that has often come before a move — it is not a promise that the move will come.
Switching patterns on and off
#The AI Patterns button in the common bar has three switches: AI Chart Patterns, AI Candlestick Patterns and AI Levels. The button shows what is on, for example AI Patterns: Chart, Levels, or AI Patterns: All.
When you log in for the first time, only Chart patterns are on, and the logged-out preview starts the same way.
To keep only some patterns in a family — say, only double tops and bottoms — pick them in Configuration. The switches in the bar turn whole families on and off.
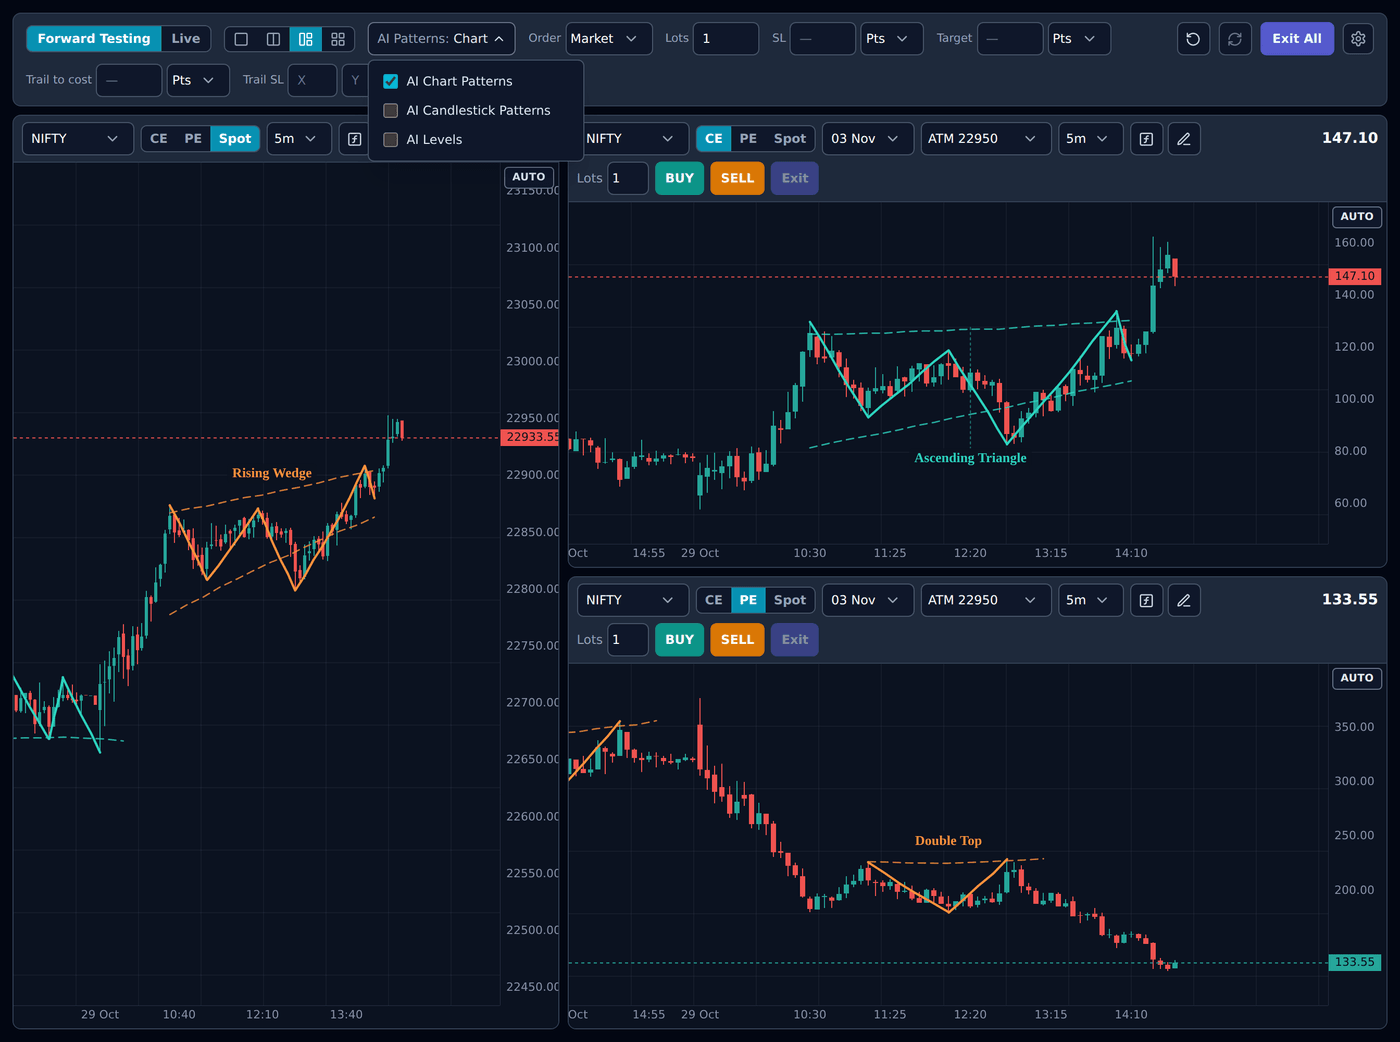
Chart patterns
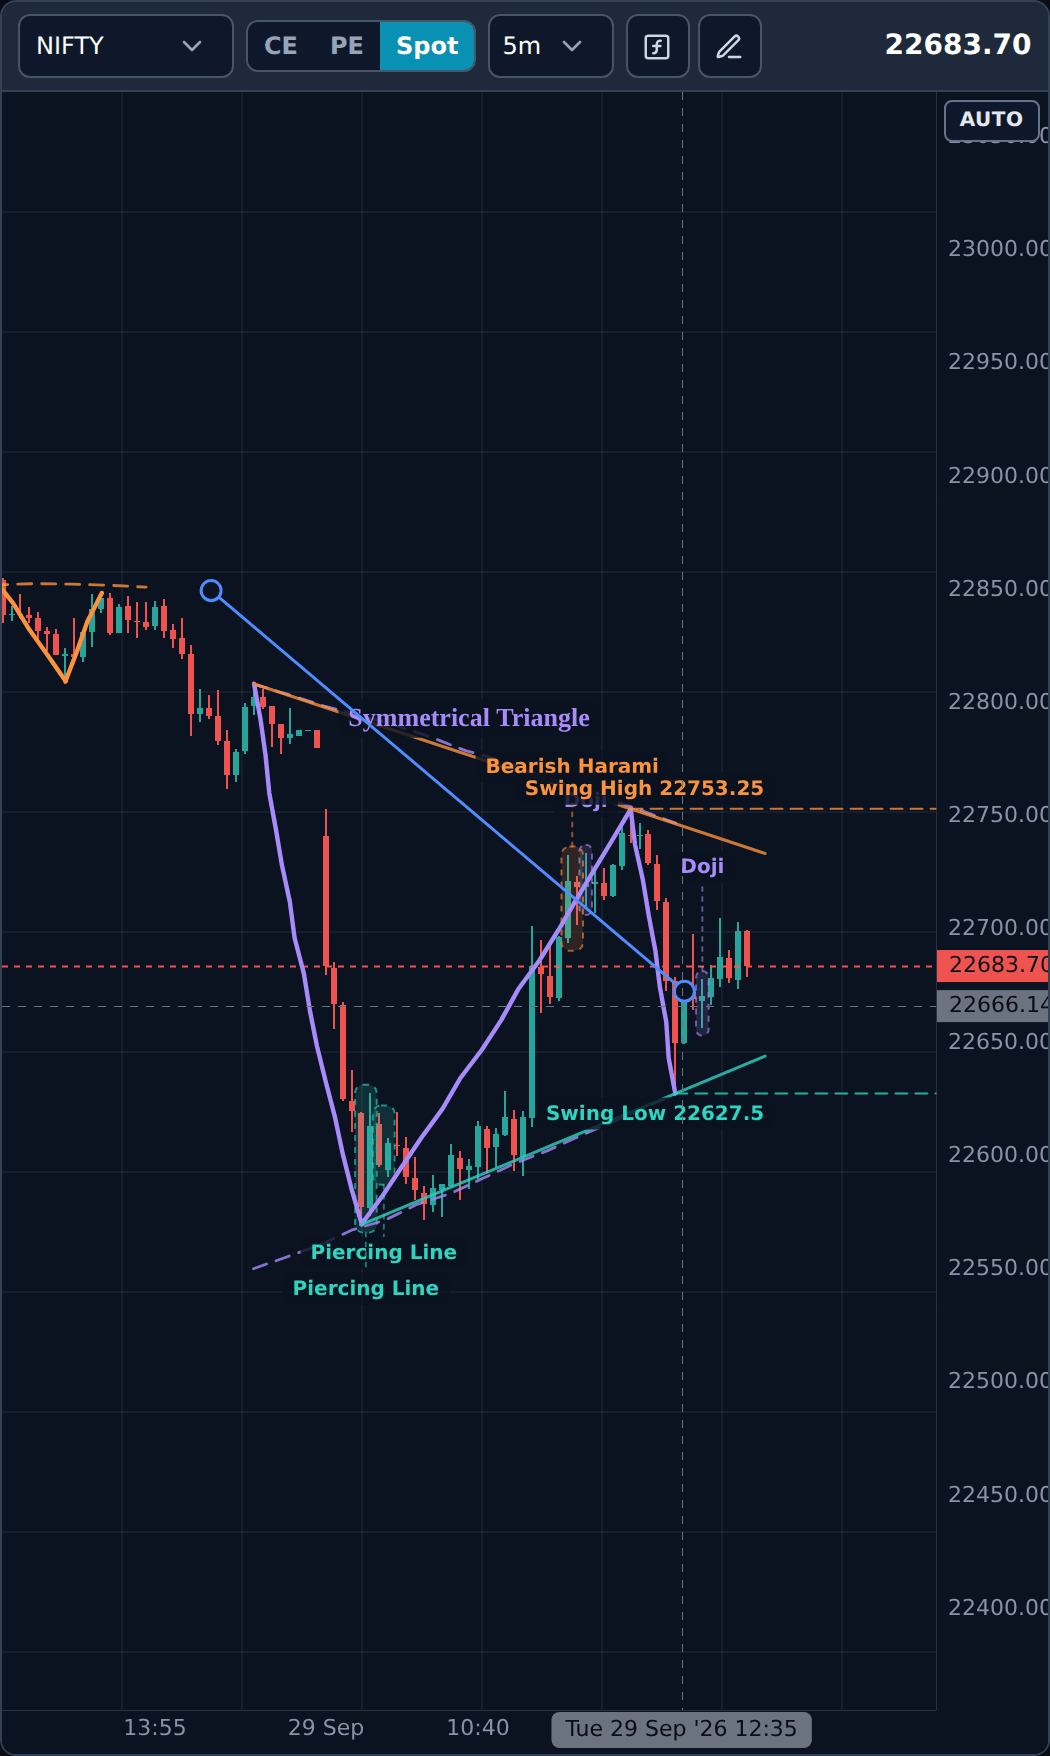
#Chart patterns are shapes made by many candles: double and triple tops and bottoms, head and shoulders (and inverse), triangles, wedges, flags, pennants and cup and handle.
They are drawn like a pen sketch through the candles, with straight guide lines through the points the pattern is named after — the two tops of a double top, the shoulders of a head and shoulders — and the name written in an empty part of the chart.
Some patterns are shown while they are still forming, drawn fainter with the word forming. For example, after two tops at about the same price, when price climbs back near that level you may see Triple Top forming. If price turns away, the warning goes; if it gets there, the finished pattern replaces it.
Patterns are judged only on finished candles. The candle that is still forming is never used, so nothing appears and vanishes inside one candle.
Candlestick patterns
#Candlestick patterns are one, two or three candles with a well-known shape: engulfing, hammer, hanging man, shooting star, inverted hammer, morning and evening star, three white soldiers, three black crows, piercing line, dark cloud cover, harami and doji.
The candles are highlighted and the name is written above or below them.
The same shape means different things in different places, so most are only reported after the move they are meant to end. A hammer is only called a hammer after a fall; the same candle after a rise is a hanging man.
AI Levels: trend lines and swing levels
#Trend lines. At most two per chart: one rising support line joining two rising lows, and one falling resistance line joining two falling highs. A trend line is removed as soon as a candle closes through it — a broken line is history, not a level to trade. A line that has drifted far away from the price is not drawn either.
Swing high and swing low. A dashed line at the latest swing high and one at the latest swing low, each running to the right edge with its price, for example Swing Low 24,180. Once a candle closes through a swing level, it is dropped and the next one that still holds is shown instead. In a straight fall there may be no swing low at all — that is the honest answer.
Indicators: picking one
#Each chart has its own indicators. The small ƒ icon in a chart’s header opens the list; a number on the icon shows how many that chart has.
The list starts with the popular ones — EMA, SMA, VWAP, Supertrend, RSI, MACD, Bollinger Bands, ATR, ADX, Stochastic, CPR — followed by every other indicator, with a search box at the top. VWAP is listed only on option and commodity charts, which have traded volume.
Indicators are worked out in your browser from the candles on the chart, and your choices are remembered for each chart.
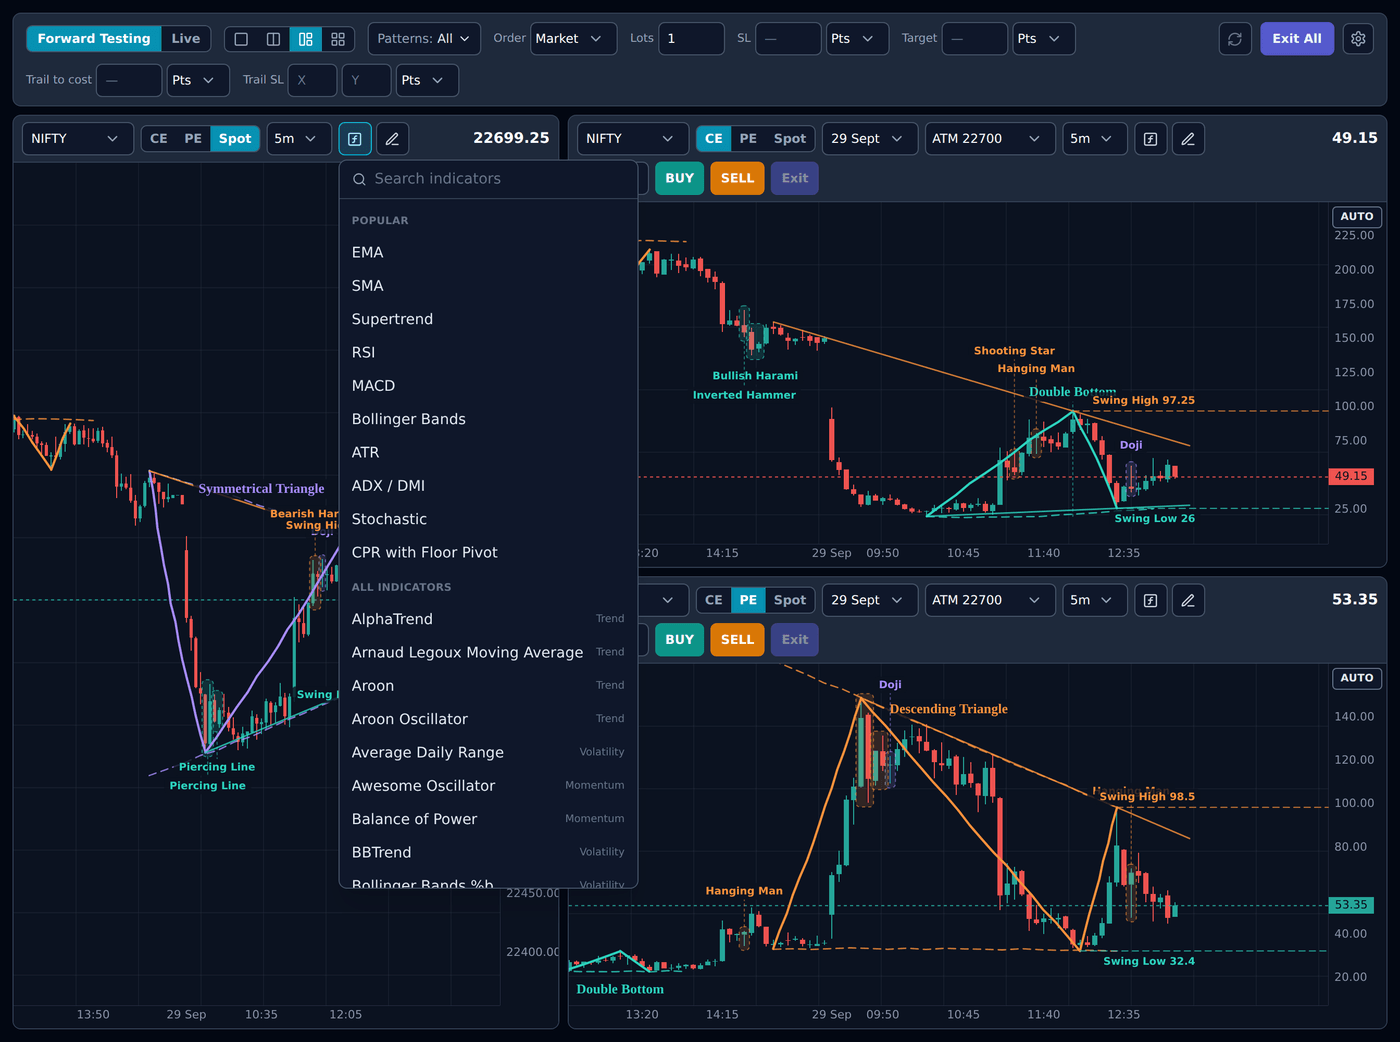
Indicators: setting the values
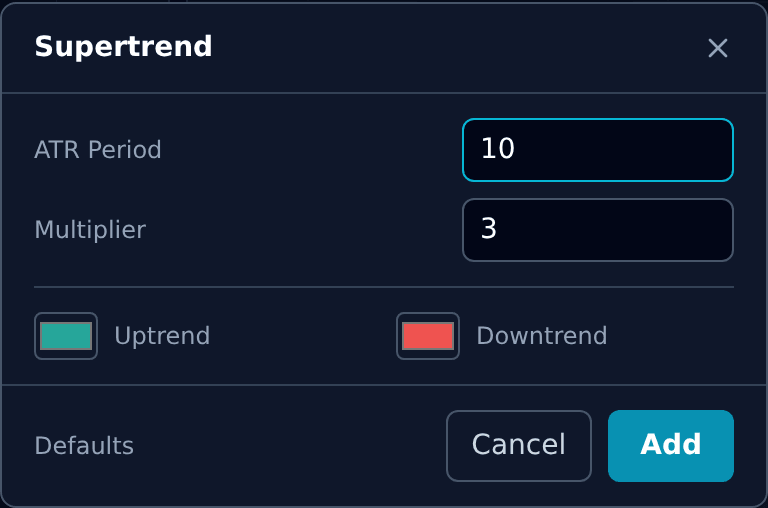
#Picking one opens its values before it is added, already filled with the usual defaults. Change what you want and press Add. For example, EMA opens with Length 9 — type 20 and Add.
Defaults at the bottom puts the usual values back. The colour boxes change the colour of each line.
You can add the same indicator more than once. EMA 20 and EMA 50 on the same chart is a common pair.
At the top of the list, under On this chart, each indicator has a pencil to change its values and an × to remove it.
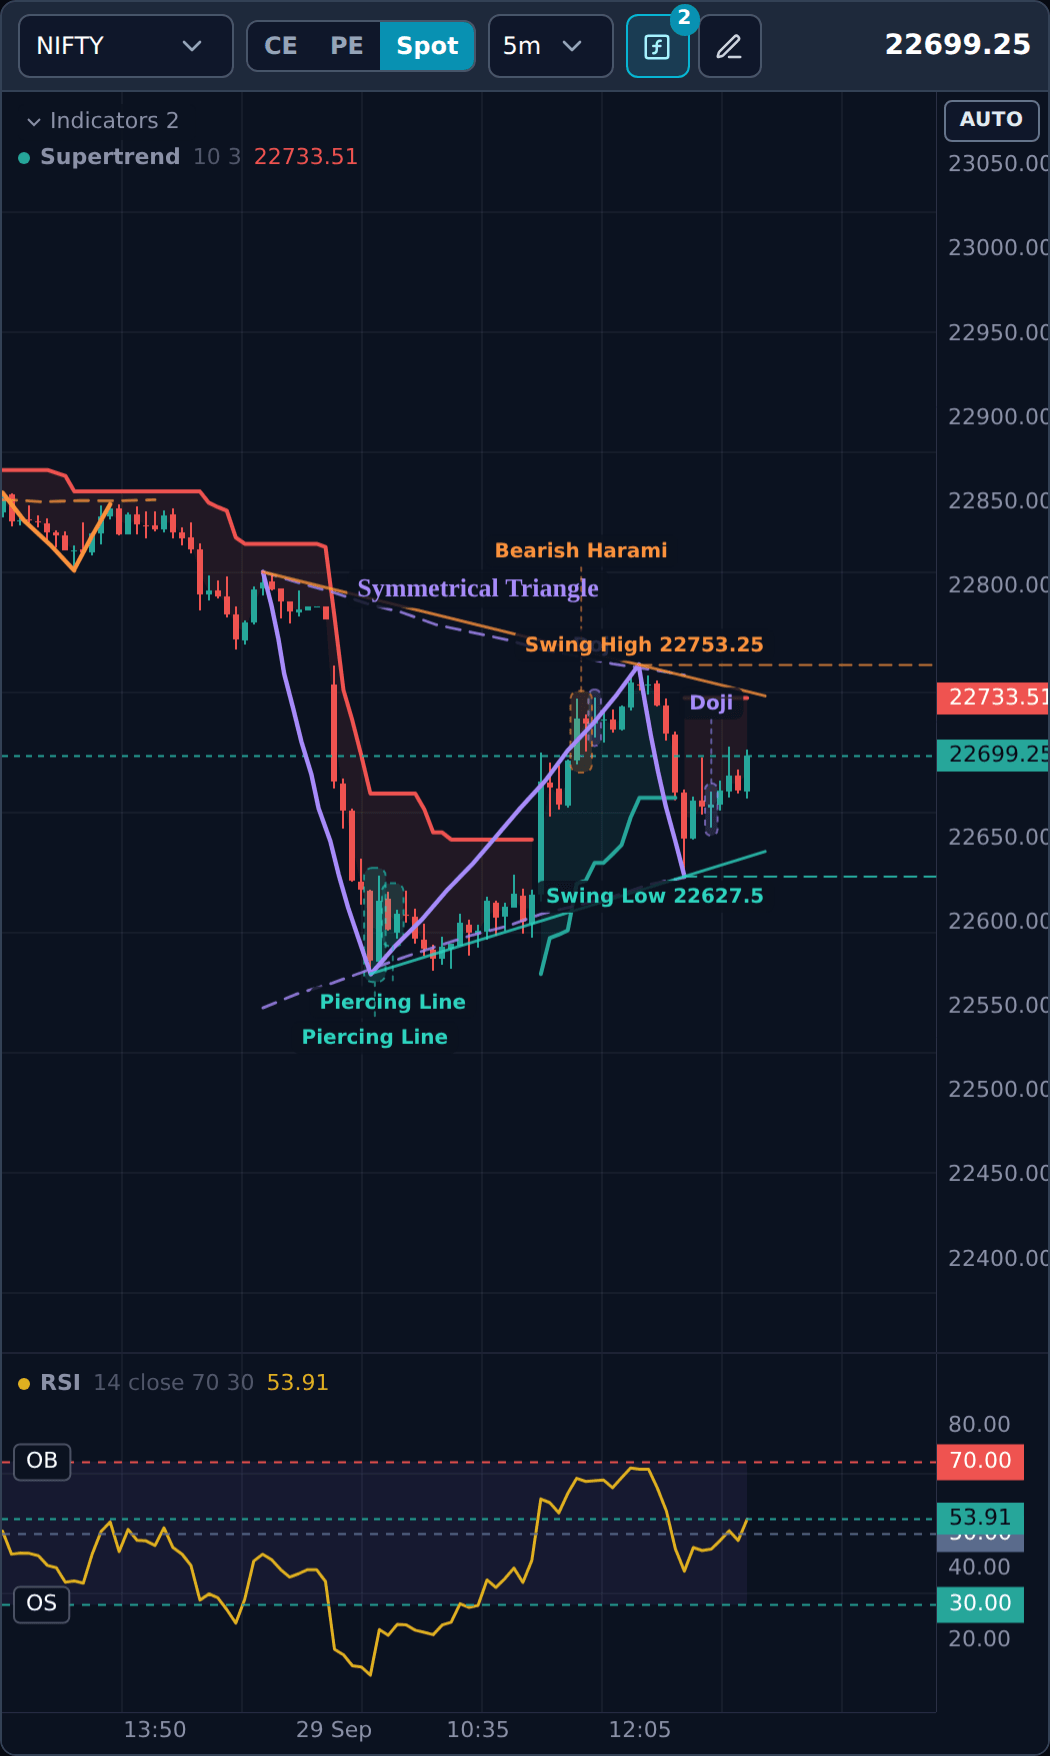
Indicators: how they look on the chart
#Some indicators draw over the candles, such as EMA, Supertrend and VWAP. Others, such as RSI and MACD, get their own small panel under the chart.
A small legend at the top left of each panel names the indicator, its values and its latest reading — for example RSI 14 close 70 30 53.91.
Drawing your own trend line
#The pen icon next to the indicators icon draws a trend line. Press it, click once where the line should start and once where it should end. The pen puts itself away after one line; press Esc to stop before you finish.
To move a line, press on it and drag. To delete it, right-click it and choose Delete trend line, or click it and press Delete on the keyboard. On a phone, tap the line and then hold your finger on it.
A line belongs to the contract and timeframe you drew it on. A line drawn on the NIFTY index at 5 minutes comes back whenever you open the NIFTY index at 5 minutes, and does not appear on the 15-minute chart.
Moving around the chart
#Drag the chart sideways to look back in time, and use the mouse wheel (or pinch on a phone) to zoom. Drag up and down on the price scale to stretch or squeeze the candles.
The AUTO button at the top of the price scale puts everything back: the latest candles, the prices fitted to the screen, and room on the right for the trade tags.
No chart ever shows a price below zero.
What it cannot do?
#- Patterns and indicators never place, change or close an order.
- A pattern is not a signal. It can fail, and a finished pattern can still be followed by the opposite move.
- Volume indicators such as VWAP are not offered on an index chart — an index has no traded volume.
- The three Open Interest indicators are not offered: the candles here do not carry open interest.
- The pen draws trend lines only. There are no other drawing tools.