Strategy Automation Tools
Chart View
See exactly what the strategy saw, and answer "why did it not enter?".
Seeing what the strategy saw
#Every strategy has a Chart View. It draws the candles with your indicators underneath, on the same official data the platform used to decide.
This is the difference between guessing why something happened and knowing.
What is on it?
#Indicators that live on the price — moving averages, Supertrend, Bollinger, VWAP, levels — are drawn over the candles.
Indicators on their own scale — RSI, MACD, ADX and the rest — get their own panel underneath, because RSI running 0 to 100 cannot share an axis with a price of 24,000.
Volume, where you have used it, gets its own panel too, drawn from futures.
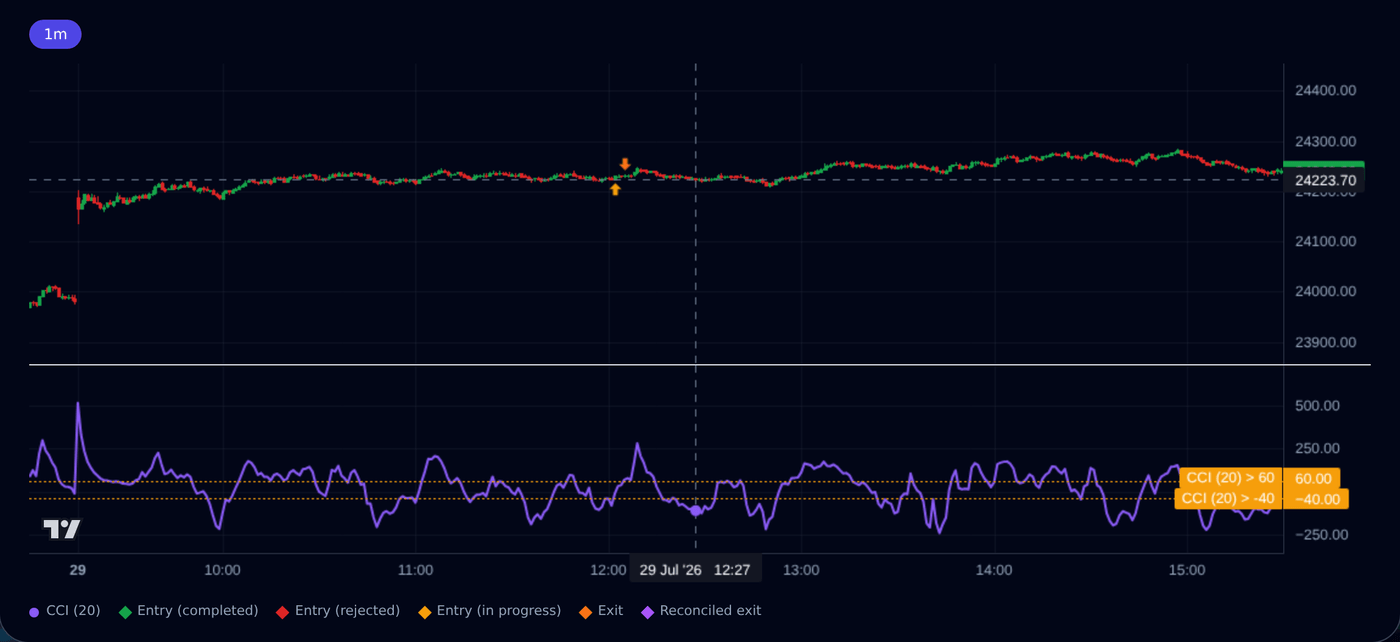
"Why did it not enter?"
#This is the question the chart exists to answer, and nine times out of ten it shows one of these:
- It came close but never crossed. RSI reached 30.4, not 30. The rule was correct and simply not met.
- It crossed inside a candle and recovered. The platform checks at the close, so a dip that did not last does not count.
- One rule in an AND group was false. Every rule has to be true at the same moment, and the chart shows you which one was not.
- The market was closed, or the day was not one of your active weekdays.
Read it honestly
#It is tempting to look at the chart, spot the trade you missed, and loosen the rule until it would have caught it.
Do that repeatedly and you end up with a strategy perfectly shaped to last week and useless next week.
A better use: check the strategy did what you asked. If it did, the chart has done its job — even when the answer is one you did not want.