Discretionary Trading Tools
Trade Charts: Trading from the Chart
The common bar, Buy and Sell, the chart menu, dragging lines, TP / SL types, trail to cost, trailing stop and every way to exit.
Every way to trade from the chart
#This page covers everything that sends, changes or closes an order in Trade Charts. The examples all use the same trade so you can follow one story: one lot (65 quantity) of the NIFTY 24,250 CE bought at Rs 100.
One point on this option is worth Rs 65 to you, because you hold 65 quantity.
The common bar: settings for every new order
#The bar at the top applies to every order you place from any chart, until you change it. It is how you set your usual stop once instead of on every trade.
SL, Target, Trail to cost and Trail SL take points (Pts) or percentage (%) only — never a price. The reason: one bar serves every chart, and a price like Rs 90 means something on the Rs 100 call and nothing on a Rs 40 put. Ten points means the same thing on both.
Exit Values starts on Every trade: SL, Target, Trail to cost and Trail SL stay for every new order. Choose One time and they apply to the next order only — once that order is accepted their boxes clear, the units stay. A refused order keeps the values. Reset puts Exit Values back to Every trade.
These values are used when an order is placed. Changing the bar later does not change trades that are already open — for those, use the position’s own menu or drag its lines.
Reset (the curved-arrow icon) clears the order and risk values in this bar: Market, Lots 1, blank limit price, SL, Target, Trail to cost and Trail SL, with Pts units. It also sets every chart’s Lots back to 1. Layout, charts, AI Patterns, indicators, mode, Configuration and existing trades stay as they are.
- Forward Testing / Live — whether real money moves.
- Layout — 1, 2, 3 or 4 charts.
- AI Patterns — which pattern families are drawn.
- Order — Market, or Limit with a price box next to it.
- Lots — typing here sets the lots on every chart at once. Each chart also has its own Lots box if you want one chart different.
- SL and Target — for example SL 10 Pts on a Rs 100 buy puts the stop at Rs 90; SL 10 % does the same.
- Trail to cost — when profit reaches this much, the stop moves to your entry price.
- Trail SL — two boxes, X and Y: every X of profit, the stop moves up by Y.
- Update all (the round-arrow icon), Exit All, and the Configuration gear.
Buy and Sell from a chart’s header
#Every option chart has BUY and SELL in its header, with its own Lots box. Pressing one sends an order for that chart’s contract, using the Order type and the SL, Target, Trail to cost and Trail SL in the common bar.
Example: the common bar says Market, SL 10 Pts, Target 20 Pts, and the 24,250 CE chart has Lots 1. Pressing BUY there buys 65 quantity at the market; with the fill at Rs 100 the stop is Rs 90 and the target Rs 120.
If the Order type is Limit, the order goes at the price you typed beside it. A buy limit must be below the current price and a sell limit above it — otherwise it would simply fill at once, and a market order is the honest way to ask for that.
Whether the order is MIS or NRML is set once in Configuration under Product.
The chart menu: right-click, or hold your finger
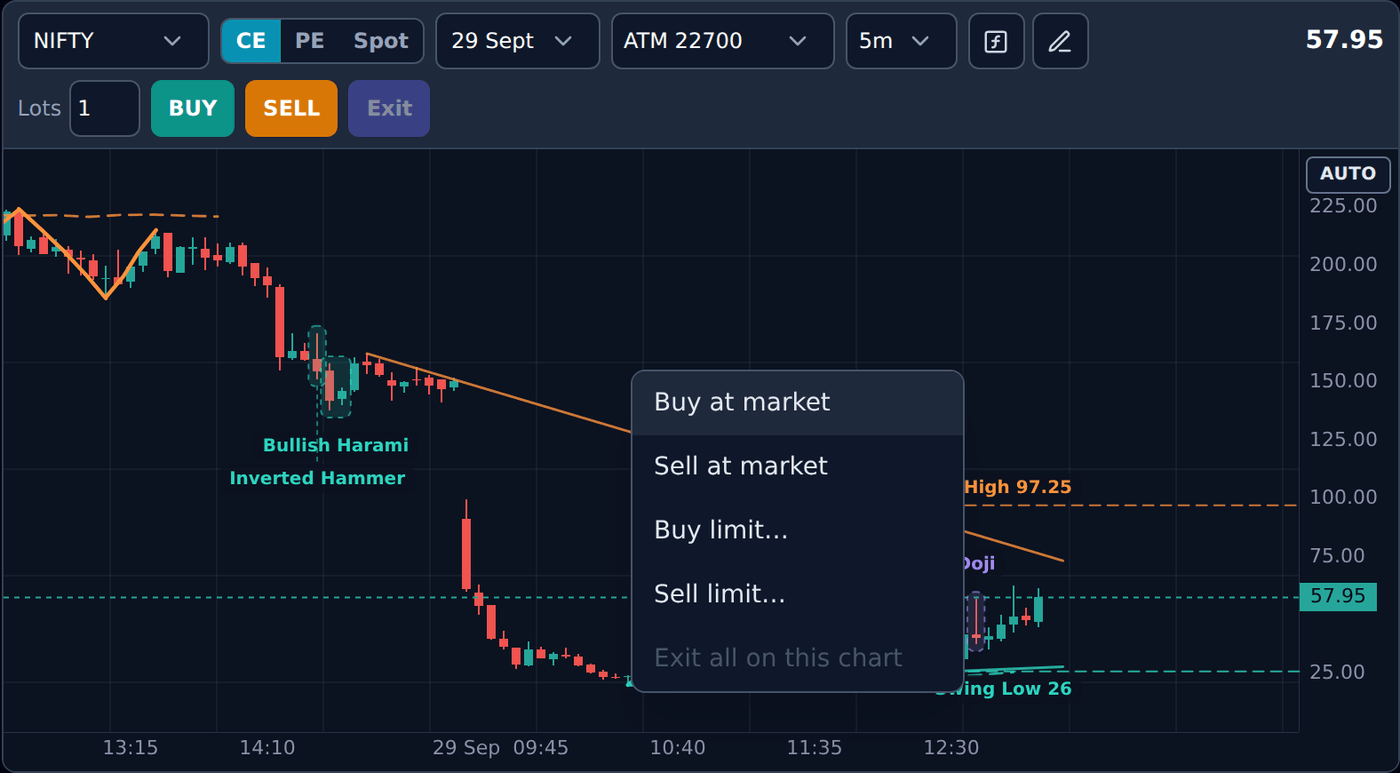
#Right-click anywhere on an option chart (or hold your finger still on it for half a second on a phone) and a menu opens:
The limit items open a small price box. Type the price, and press Enter or the button. The app never fills in a price for you — the number is always yours.
- Buy at market and Sell at market.
- Buy limit… and Sell limit… — asks for your price.
- Change limit price… — shown when a limit order on this chart has not filled yet.
- Exit all on this chart — closes every position on this chart and cancels its unfilled orders. Other charts are not touched.
Reading the lines and tags
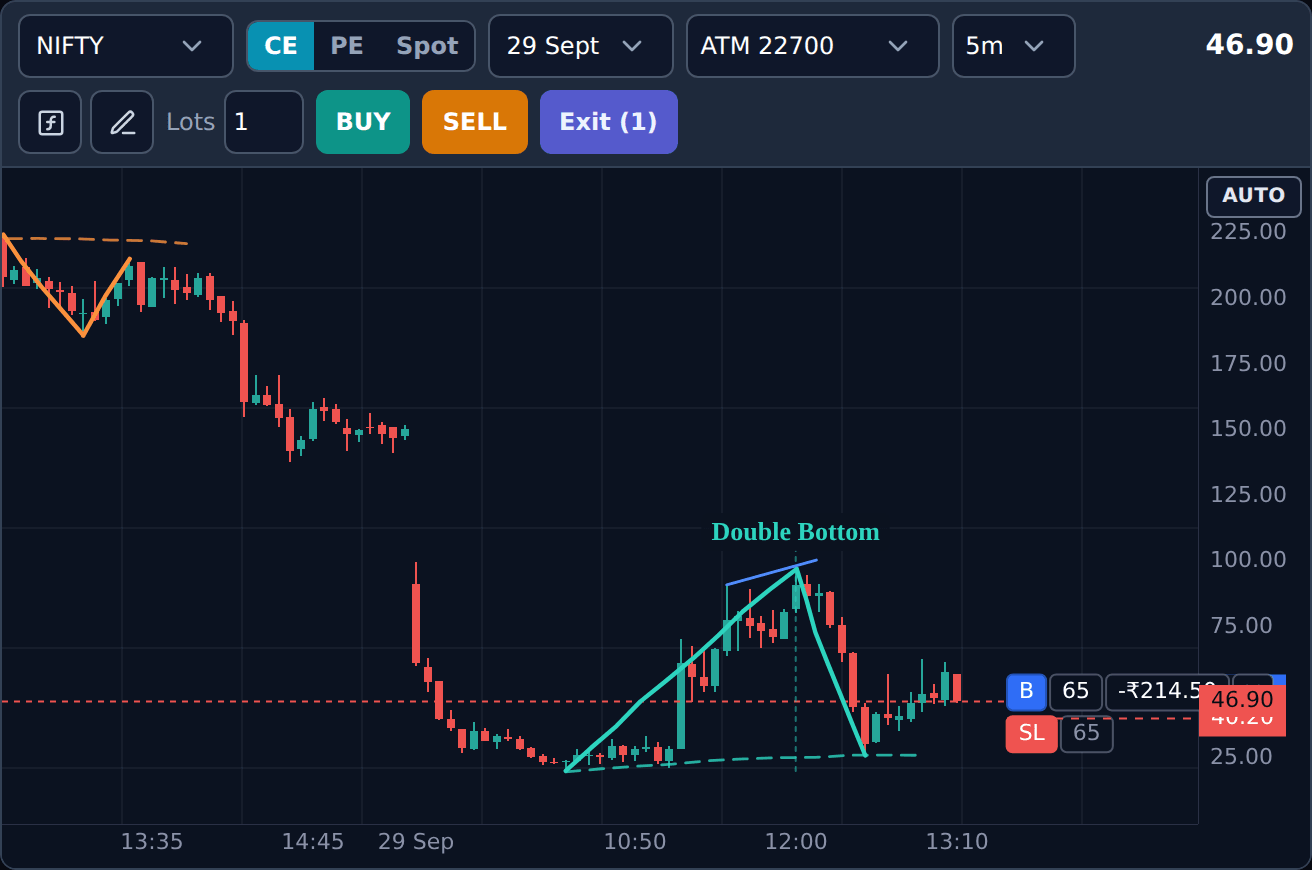
#Every trade on a chart draws its own lines on the right-hand side of the chart, next to the price scale. They are short on purpose, so the candles keep the width.
If you open two trades on the same chart, both sets of lines are drawn. Each one keeps its own tag, stop and target.
When trail to cost has moved your stop to the entry price, the stop and the entry sit on the same level. The tags then stack underneath the position tag instead of running into it, so each one stays readable and can still be dragged.
- The position tag — a blue B (bought) or red S (sold), the quantity, the running P&L in rupees, and × to exit that trade. For example B · 65 · +Rs 520 · × when the option is at Rs 108.
- The SL line (red) with an SL tag, and the TP line (green) with a TP tag.
- T2C and TSL tags beside the position tag, when trail to cost or a trailing stop is set on that trade.
- A pending entry — a limit order that has not filled — has its own line and tag with an × to cancel it.
Dragging a line to change a trade
#Press on a stop, target or pending-entry line and move it. When you let go, the new level is saved. A plain click without moving changes nothing.
Example: you bought at Rs 100 with the stop at Rs 90. The option reaches Rs 112. You drag the SL line up to Rs 104. From now on, if the price falls to Rs 104, the trade exits with about Rs 260 profit (4 points × 65) instead of a Rs 650 loss.
Dragging a pending limit entry moves the order’s price at your broker. The broker has to accept the change first; only then does the line stay where you put it.
The line of a filled entry does not move — that price is history.
- A bought option’s stop must stay below the current price and its target above it. A sold option is the other way round. A drag to the wrong side is refused and the line goes back.
- If a trailing stop is running, dragging the stop by hand restarts the trailing from that moment. It will not suddenly jump the stop by steps it had already counted.
A position’s own menu
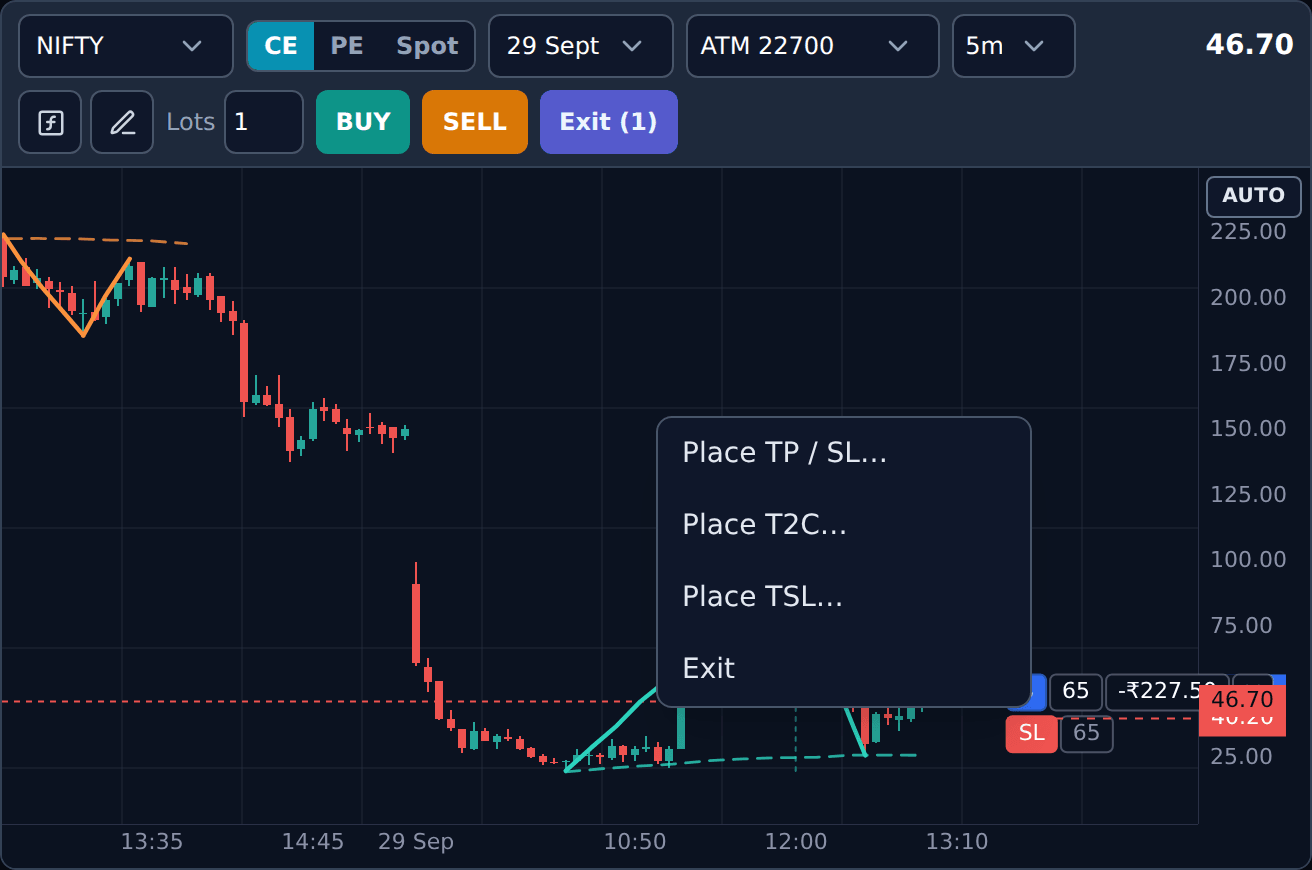
#Right-click on a position’s tag or line (or hold your finger on it) and you get that trade’s menu instead of the order menu:
Anything already set on that trade is greyed out. To change a stop or target that is already there, drag its line. To remove one, see the next section.
- Place TP / SL… — set a target and a stop in one small form.
- Place T2C… — trail to cost for this trade.
- Place TSL… — a trailing stop for this trade, with X and Y.
- Exit — close this trade only.
TP / SL: four ways to say the same level
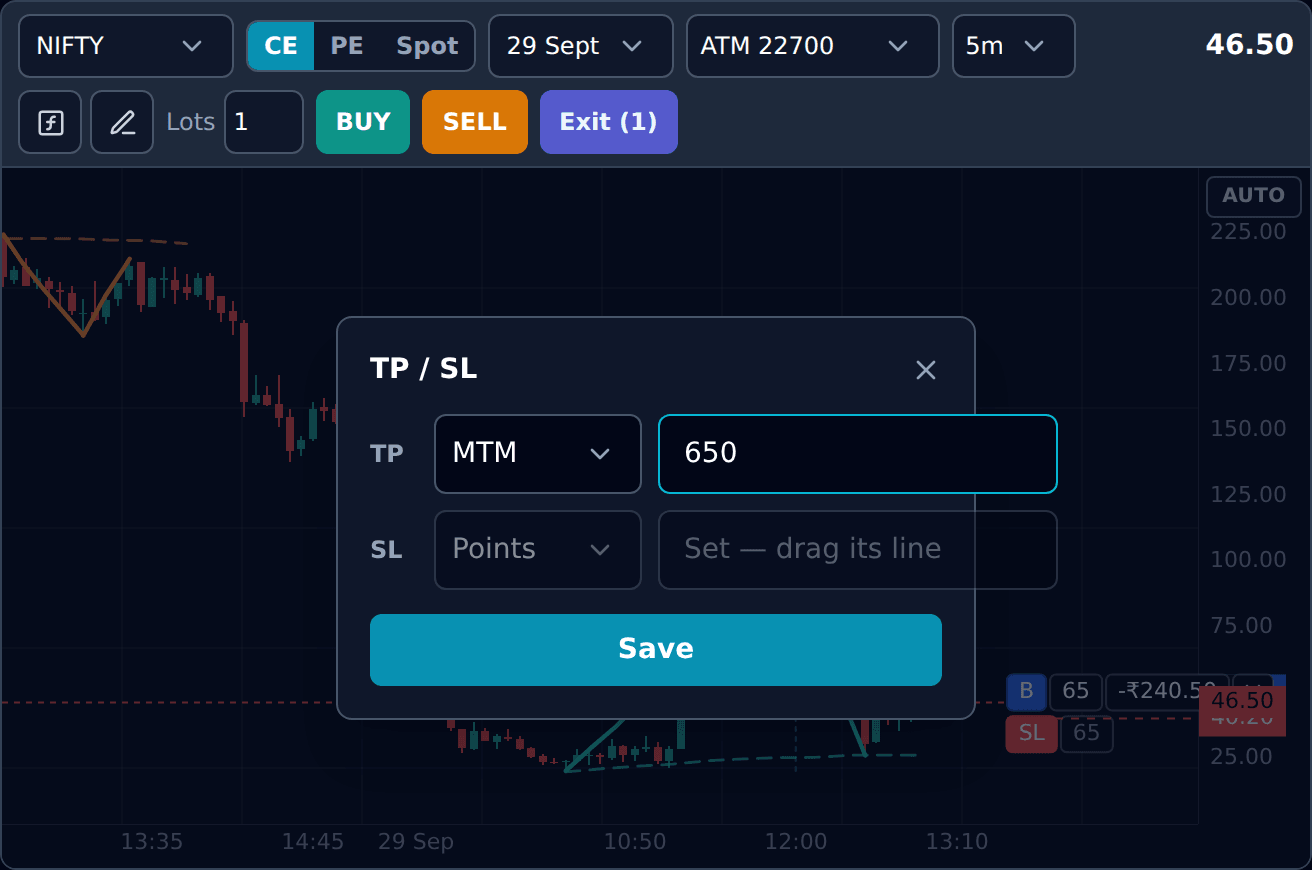
#The TP / SL form has two rows, TP and SL. Each row has a type and a value. The type says what the number means:
Here is the same trade — one lot bought at Rs 100 — with the target set four different ways. All four put the target at Rs 120.
And the stop at Rs 90, the same four ways: Points 10; Absolute 90; MTM 650 (Rs 650 ÷ 65 = 10 points); Percentage 10.
Fill only the row you want — either one is enough. Press Enter or Save.
- Points (the default) — how far from your entry. Target 20 → Rs 120.
- Absolute — the exact price. Target 120 → Rs 120.
- MTM — how many rupees of profit or loss on the whole trade. Target 1300 → Rs 1,300 ÷ 65 quantity = 20 points → Rs 120.
- Percentage — a percentage of your entry price. Target 20 → 20 % of Rs 100 = Rs 20 → Rs 120.
Trail to cost and trailing stop
#Trail to cost (T2C) moves your stop to your entry price once the trade has made enough profit, so a winning trade cannot turn into a loss. Example: T2C 10 Pts on the Rs 100 buy. When the price reaches Rs 110, the stop moves from Rs 90 to Rs 100.
Trailing stop (TSL) follows the price up in steps. It has two numbers: X, how much profit makes one step, and Y, how far the stop moves on each step. Example: stop Rs 90, X = 10, Y = 5. Price reaches Rs 110 → stop moves to Rs 95. Price reaches Rs 120 → stop moves to Rs 100.
Both can be set for every new order in the common bar, or for one open trade from its menu (Place T2C…, Place TSL…), in points or percentage.
A trailing stop only moves one way — towards profit. It never moves back down when the price falls.
Removing a stop or a target
#Right-click on the SL line (or its tag) and choose Cancel SL. Right-click on the TP line and choose Cancel TP. The line disappears and the trade carries on without it.
Think twice before removing a stop on a live trade. Without one, nothing closes the trade for you if the market runs against it.
Every way to exit
#From the smallest to the biggest:
- The × on a position tag, or Exit in its menu — that one trade.
- Exit (n) in a chart’s header — every position on that chart, and it cancels that chart’s unfilled orders. The number shows how many it will close.
- Exit all on this chart in the chart menu — the same as the header button.
- Exit All in the common bar — every Trade Charts position in the current mode (Forward Testing or Live), on every chart. Positions from your other tools are not touched.
When ATM moves
#Say you opened the right-hand chart as ATM 24,250 CE. NIFTY rises to 24,300, and ATM is now 24,300. The chart does not switch by itself — you may have a trade on the 24,250 and still be watching it.
Instead an amber strip appears over that chart: ATM is now 24300. with an Update button. Press it and the chart moves to the 24,300 CE. Ignore it and the chart stays where it is.
If the chart was opened as, say, 2 OTM, Update takes it to what is 2 OTM now.
Choosing a strike yourself also chooses its current ATM/ITM/OTM offset. With ATM at 24,250, selecting 24,150 CE chooses 2 ITM when strikes are 50 points apart. Update stays grey while that strike is still 2 ITM; when ATM moves, Update offers the new 2 ITM strike.
The round-arrow icon just before Exit All does the same for every chart at once. It turns amber and shows a number when one or more charts are waiting for an update; otherwise it is grey.
When a saved expiry is no longer listed, its replacement opens at the saved ATM/ITM/OTM offset using the current chain. For example, an old ATM chart opens at today’s ATM for the new expiry; an old 2 ITM chart opens at today’s 2 ITM. A chart whose expiry is still listed stays on its saved strike.
Sounds
#A short, quiet sound plays when an order fills and when a trade closes — whether you closed it, or its stop, target or trailing stop did. A different sound plays when something fails. The same sounds play across every tool on the platform.
If something does not work
#Check these in order.
- A limit order is refused — a buy limit above the market (or a sell limit below it) would fill at once. Use a market order, or type a price on the correct side.
- Place TP / SL… is greyed out — that trade already has both. Drag the lines to change them, or cancel one first.
- My new SL in the common bar did not change my open trade — the bar is for new orders. Use the trade’s own menu or drag its line.
- The line snapped back after a drag — the level was on the wrong side of the current price.
- Nothing happened when I dragged a pending entry in Live — the broker refused the change. The line goes back to the price the broker still holds.