Discretionary Trading Tools
Trade Scalper Dashboard
Detailed guide for Trade Scalper dashboard controls, risk fields, actions, and examples.
Overview
#Trade Scalper is for discretionary traders who manually decide entries and exits, especially scalpers and intraday traders who need fast execution controls.
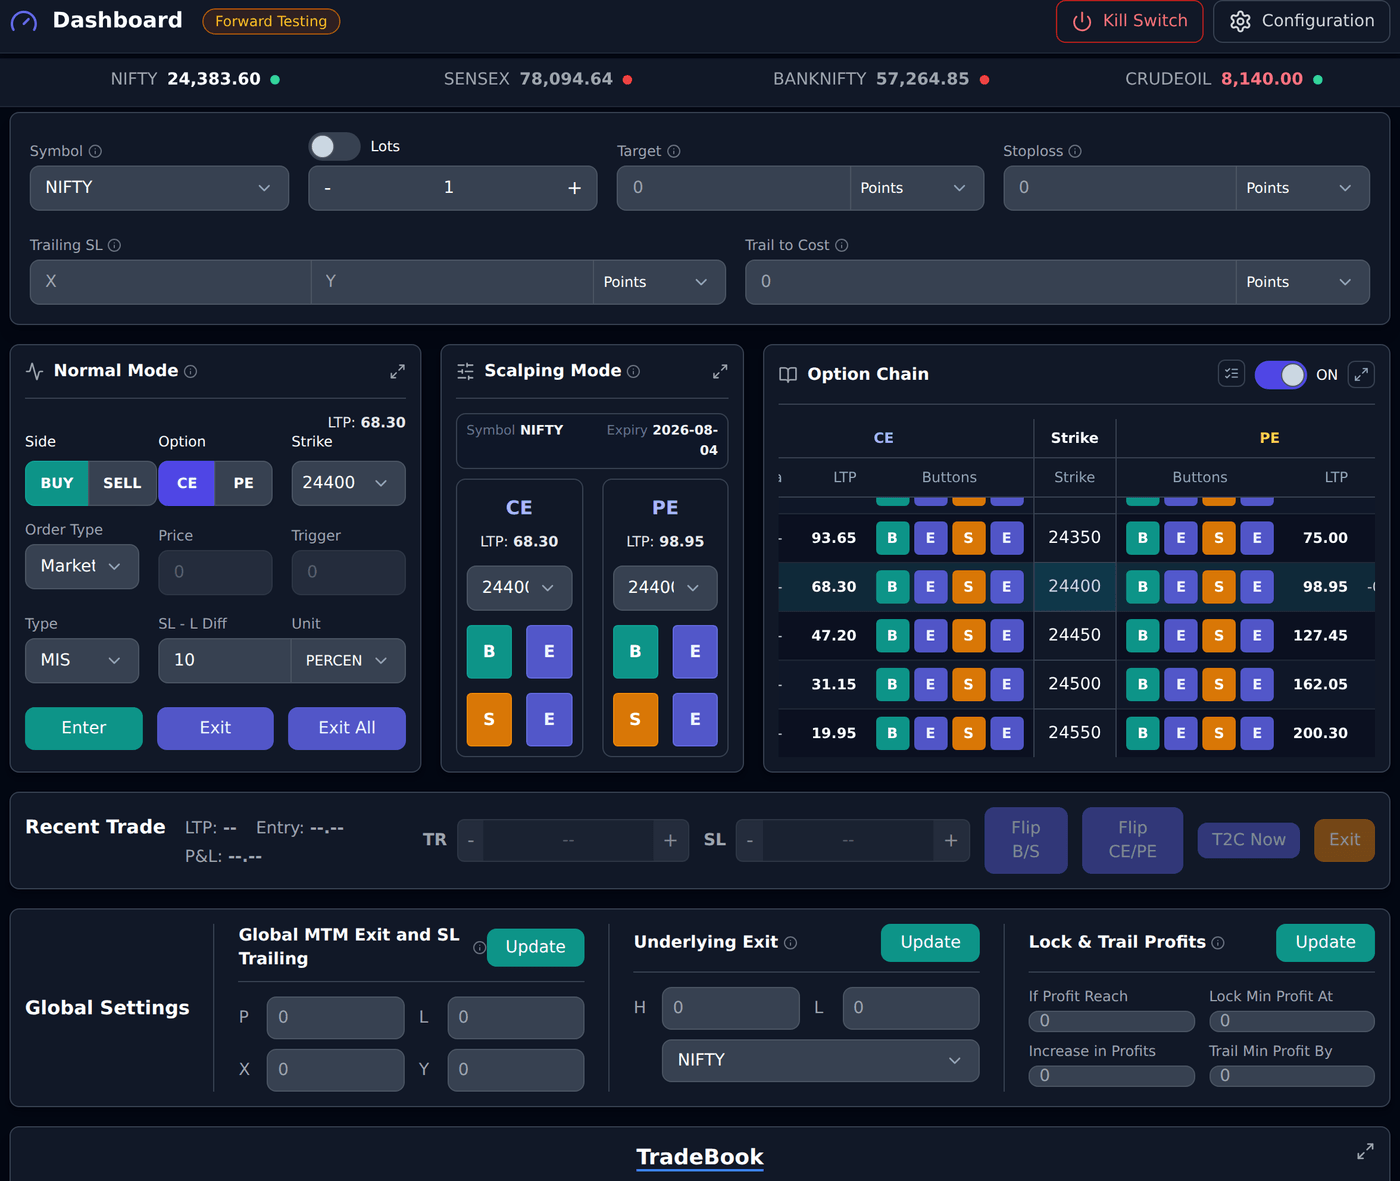
The dashboard is the main trading screen. Start with entry controls, then understand trade risk fields, option chain, global settings, and trade management actions.
Broker Selector
#Broker Selector chooses which assigned broker account should be used for live actions.
When you change the broker on the dashboard, the app saves it as the default broker for Trade Scalper. Order placement is blocked if the selected broker is missing or not connected.
Mode Selector
#Mode decides whether the order is Forward Testing or Live Mode. The dashboard shows the current mode as a badge next to the title; it cannot be changed there.
To change it, open Trade Scalper Configuration and set Select Mode to Forward Testing or Live Mode. The dashboard follows that setting.
Before placing live orders, confirm mode, broker, segment, quantity, symbol, and side. Forward Testing is for practice/recording style flow; Live Mode is broker-bound where supported and connected.
Top trade defaults
#Exact field names in the top row are Symbol, Lots/Capital or QTY, Target, Stoploss, Trailing SL, and Trail to Cost.
These values become runtime controls on newly placed Trade Scalper orders. Change them before entry if you want the new trade to carry those risk values.
Desktop trade ticket fields
#Exit Values starts on Every trade: Target, Stoploss, Trailing SL and Trail to Cost stay for every new order. Choose One time and they apply to the next order only — once that order is accepted their boxes clear, the units stay. A refused order keeps the values. Reset puts Exit Values back to Every trade.
Exact field names in the desktop trade ticket are Symbol, Lots/Capital or QTY, Target, Stoploss, Trailing SL, Trail to Cost, Side, Option, Strike/Symbol, Order Type, Trigger, Price, Type, SL - L Diff, Unit, Enter, Exit, and Exit All.
Symbol chooses what you want to trade. Target is the profit booking value. Stoploss is the loss limit. Trailing SL uses X and Y: X is the profit step and Y is how much SL moves. Trail to Cost moves SL to entry price after the selected profit trigger.
Simple BUY example using the same field names: entry is Rs 100, initial Stoploss is Rs 90, Trailing SL X is 10, and Trailing SL Y is 5. When price reaches Rs 110, SL moves to Rs 95. When price reaches Rs 120, SL moves to Rs 100. If Trail to Cost is 20, then at Rs 120 the SL moves to cost at Rs 100.
Mobile trade ticket fields
#The mobile trade ticket keeps the same important controls in a smaller layout: Symbol, Lots/quantity, Scalping switch, Side, Option, Target, and Stoploss.
Before placing a live mobile order, confirm broker, mode, symbol, quantity, side, option type, Target, and Stoploss. Mobile screens are compact, so recheck values carefully before tapping an order action.
Normal Mode
#Normal Mode is the regular order form for slower, careful order entry.
Exact field names and buttons in Normal Mode include Side, Option or Type, LTP, Strike or Symbol, Order Type, Trigger, Price, Type, SL - L Diff, Unit, Enter, Exit, and Exit All.
Side has BUY and SELL. Option has CE and PE for option segments. Strike or Symbol selects the contract. Order Type decides Market, Limit, Buy Above/Sell Below, or Underlying where available. Price and Trigger are used only when the selected Order Type needs them. With Underlying, Price is the index level (for example NIFTY 24700), not the option price; it must be within 10% of the index.
Example: You want to BUY one option. Select Side as BUY, Option as CE, choose Strike, keep Order Type as Market or choose Limit with a valid Price, confirm Type such as MIS, then click Enter. Use Exit for the selected/open trade and Exit All when you want to exit all active Trade Scalper positions visible to the account.
Scalping Mode
#Scalping Mode gives faster controls for CE/PE and Buy/Sell style actions.
Exact field names and buttons in Scalping Mode include Symbol, Expiry, CE, PE, LTP, strike dropdown, B, S, and E.
B means Buy, S means Sell, and E means Exit for that side/contract. CE and PE panels each have their own strike dropdown and LTP display.
When Strike View in Configuration is ATM/OTM/ITM, each dropdown keeps the position you chose. ATM stays ATM and 2 OTM stays 2 OTM as the market moves; only the strike in brackets changes to follow the new ATM.
Example: If Symbol is NIFTY and Expiry is the selected expiry, choose the CE strike you want, then click B to buy CE or S to sell CE. Click E to exit an open position for that selected contract. Use Scalping Mode only after broker, mode, quantity, Symbol, and top risk defaults are correct because the buttons are meant for speed. If option segment is not selected, scalping controls can be disabled.
Order Type
#Order Type controls how the order should be placed.
Market sends market-intent order. Limit needs a price. Buy Above/Sell Below needs both Price and Trigger Price. Underlying needs a trigger level in Price and watches the underlying level. For user-intent market orders, the backend may still use broker-safe buffered limit behavior because some broker APIs block direct market orders.
Limit and trigger examples
#BUY Limit example: if option LTP is Rs 100, the Limit Price must be below Rs 100. If you enter Rs 105 for a BUY Limit, the dashboard blocks it because that is not a proper buy-below limit.
SELL Limit example: if option LTP is Rs 100, the Limit Price must be above Rs 100. Buy Above/Sell Below example: for BUY, Trigger must be less than Price; for SELL, Trigger must be more than Price.
Buy / Sell
#Buy means you are entering a long side of that instrument. Sell means you are entering a short side where allowed.
The examples in this documentation use BUY entry price 100 and quantity 1 for consistency.
Quantity / Lots / Capital
#Quantity is the number of lots or units used for the trade, depending on the segment and instrument.
The dashboard can show Lots/Capital style input. Always verify quantity before live order placement. A wrong quantity can create much larger risk.
Price and Trigger Price
#Price is used when the selected order flow needs a limit price or underlying trigger level.
Trigger Price is used for Buy Above/Sell Below. If the required price field is blank or invalid, the dashboard blocks order placement before sending it.
Stop Loss
#Stop Loss is the level where the app tries to cut loss for the trade.
Units in Trade Scalper include Points, %, MTM, Underlying, and Absolute Value. Points is easiest for beginners.
BUY example with entry Rs 100 and quantity 1: SL 10 Points means SL price is Rs 90. SL 10% also means Rs 90. SL MTM 10 means the trade watches for Rs 10 loss, so with quantity 1 it is at Rs 90. SL Absolute Value 90 means the SL price is exactly Rs 90.
Underlying SL is different: it watches the underlying/index level, not option price. Example: if trading a NIFTY option and Underlying SL is 23800, the exit condition watches NIFTY at 23800.
Target
#Target is the level where the app tries to book profit for the trade.
BUY example with entry Rs 100 and quantity 1: Target 30 Points means target price is Rs 130. Target 30% also means Rs 130. Target MTM 30 means the trade watches for Rs 30 profit, so with quantity 1 it is at Rs 130. Target Absolute Value 130 means the target price is exactly Rs 130.
Underlying Target watches the underlying/index level. Example: if trading a NIFTY option and Underlying Target is 24000, the exit condition watches NIFTY at 24000.
Trailing Stop Loss
#Trailing SL has X and Y. X means after how much favorable move the SL should shift. Y means how much the SL should shift. Both X and Y are required; if only one is entered, the dashboard shows an error.
BUY example: Entry Rs 100, initial SL Rs 90, X 10 Points, Y 5 Points. When price reaches Rs 110, SL moves from Rs 90 to Rs 95. When price reaches Rs 120, SL moves from Rs 95 to Rs 100. When price reaches Rs 130, SL moves to Rs 105.
Important: the code tracks peak favorable move. If price reaches Rs 120 and then falls to Rs 115, SL does not move down. It stays at the better protected level.
Trail To Cost
#Trail To Cost, or T2C, moves SL to the entry price after the trade has enough profit.
BUY example: Entry Rs 100, initial SL Rs 90, T2C 20 Points. If price reaches Rs 110, T2C does not activate because profit is only 10 points. When price reaches Rs 120, T2C activates and SL moves to Rs 100. After that, if price falls to Rs 100, the trade is protected at cost instead of original Rs 90 SL.
T2C Now button is different: it tries to move SL to cost immediately for an already profitable active trade. The dashboard blocks T2C Now if the trade is not in profit.
SL-L Diff
#SL-L Diff controls the trigger-to-limit gap for broker-terminal stop-loss orders in Trade Scalper.
Default logic depends on segment: option segments default around 19%, futures around 1%, unless saved values override it.
Example: You BUY one option at Rs 100 and your stop-loss trigger is Rs 90. If SL-L Diff is 2 points, the stop-loss trigger is Rs 90 but the broker limit price can be around Rs 88. If SL-L Diff is 19%, the limit gap is calculated as a percentage as supported by the backend.
Why this matters: after the trigger hits Rs 90, the exit order has a price gap to improve the chance of execution. A very small gap may not execute in fast markets, while a very large gap may increase slippage.
Option Chain
#Option Chain shows strikes, CE/PE prices, and available quote data.
It can show bid, ask, IV, delta, theta, gamma, vega, OI, volume, and symbol columns depending on available data and optional column settings. Logged-out or broker-disconnected users can see snapshot-only data. Broker-connected users can receive realtime option-chain updates.
Option Chain toggle
#The Option Chain panel has an ON/OFF control.
If it is OFF, the dashboard does not fetch option-chain rows. Turn it ON only when you need option-chain data.
Strike selection
#When option-chain data has ATM strike, the dashboard can auto-select an ATM strike if the selected strike is blank or no longer valid.
Clicking a CE/PE row can set the trade symbol, exchange, option type, and strike. If selected underlying and clicked contract do not match, the dashboard blocks the order and asks you to refresh option chain.
Global Settings
#Global Settings apply broader controls to active Trade Scalper trades.
Exact section names on the dashboard are Global MTM Exit and SL Trailing, Underlying Exit, and Lock & Trail Profits. Each section has its own Update button. Click Update in that section after changing values.
Reset in the dashboard header clears dashboard inputs and disables and clears all Global Settings. New orders return to the default ticket values, including quantity 1 and Market. Configuration, broker selection, mode, orders, positions, trade history and each existing trade’s own protections are retained. Global Settings affect both Live and Forward Testing, so reset clears those shared limits in both modes.
Global MTM Exit and SL Trailing
#Exact field names in this section are P, L, X, and Y.
P means profit exit amount. L means loss exit amount. X means the profit step for global trailing. Y means how much the global loss level moves after each X step.
These are judged on the WHOLE DAY, not on open trades alone: the profit or loss already booked on closed trades PLUS the open trades’ running MTM. A trade closed at a loss earlier in the day still counts.
They are also judged SEPARATELY for Live and Forward Testing. Forward-testing money never counts towards a Live limit, and the other way round.
Example 1: Two active trades, Trade A Rs 700 profit and Trade B Rs 300 profit, and nothing closed yet. The day is Rs 1000. If P is 1000, the global profit exit can trigger.
Example 2: If L is 500, the global loss exit can trigger when the day reaches around Rs -500 — including anything already booked.
Trailing example using the same field names: Suppose L is 1000, X is 1000, and Y is 500. The starting loss level is about Rs -1000. When open profit reaches Rs 1000, the loss level can move up by Rs 500 to about Rs -500. When open profit reaches Rs 2000, it can move another Rs 500 to about Rs 0. This means the allowed loss becomes smaller as profit grows.
Underlying Exit
#Exact field names in this section are H, L, and Symbol.
H means high underlying level. L means low underlying level. Symbol selects which underlying to watch, such as NIFTY, BANKNIFTY, SENSEX, or supported MCX symbols.
Example: You are trading NIFTY options and set Symbol as NIFTY, H as 24000, and L as 23800. If NIFTY reaches 24000 or falls to 23800, the global underlying exit can trigger. Use this only when your plan depends on the underlying level.
Lock & Trail Profits
#Lock & Trail Profits is easier to understand as profit protection. It tries to protect part of your open profit after profit crosses a level.
Exact field names in the tool are If Profit Reach, Lock Min Profit At, Increase in Profits, and Trail Min Profit By.
If Profit Reach is the first open-profit level where protection starts. Lock Min Profit At is the minimum profit you want to protect after that first level is reached.
Increase in Profits is the next profit step. Trail Min Profit By is how much the protected minimum profit increases after each step.
Example: If Profit Reach is Rs 1000 and Lock Min Profit At is Rs 500, then when open profit reaches Rs 1000, the system starts protecting Rs 500. If profit later falls to Rs 500, exit can trigger.
Continuing the same example: if Increase in Profits is Rs 500 and Trail Min Profit By is Rs 250, protected profit becomes Rs 750 when open profit reaches Rs 1500. It becomes Rs 1000 when open profit reaches Rs 2000.
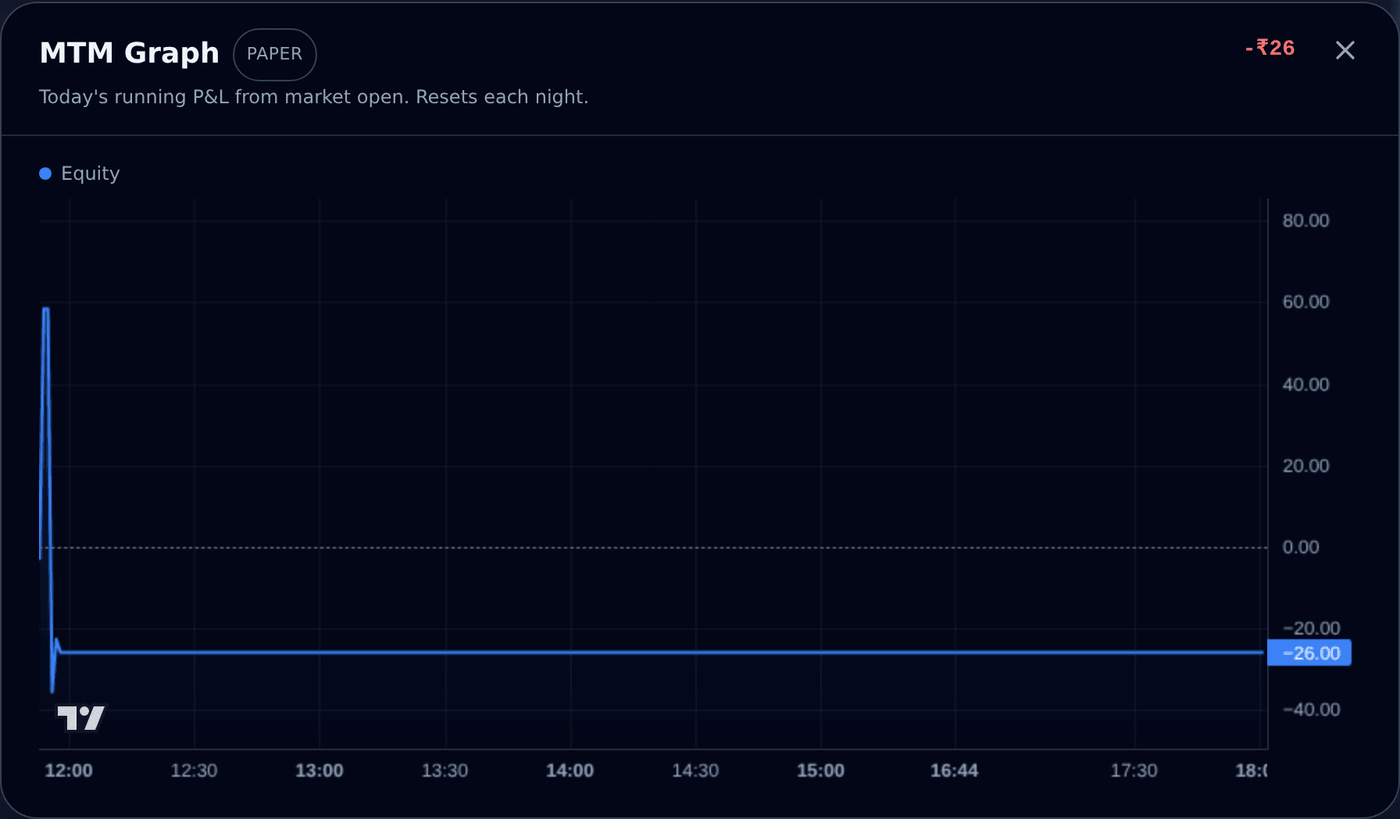
MTM Graph — your day as a line
#MTM means mark-to-market: what your trades are worth right now. The MTM Graph draws your running profit and loss for today as a line, starting from market open. Above the dotted zero line you are in profit for the day; below it you are in loss.
In TradeScalper the graph does not take up dashboard space. Open it from the small blue chart icon in the TradeBook, right next to the Realized MTM figure — it opens as a window on top of the page. Close it with the X, the Escape key, or a click outside.
The graph follows your mode selector: in Live mode it shows your live trades, in Forward Testing mode it shows your forward-testing trades. The badge at the top of the window tells you which one you are looking at.
There can be two lines. The blue line is your equity segment — NIFTY, BANKNIFTY, SENSEX options and stocks. The amber line appears only on a day you trade commodities (MCX): the blue line stops when the equity market closes at 3:30 pm, while the amber line carries on into the evening.
An example. Suppose you bought one option at Rs 100, quantity 65, at 10:15 am. The price moves to Rs 110 — the line climbs to +650. It slips to Rs 95 — the line goes to -325. You exit at Rs 110 — the profit of 650 is booked, so from then on the line stays at +650 unless another trade moves it.
- A new point is added every minute; the last point moves almost live with prices.
- The graph shows only today. It clears every night and starts fresh the next morning — past days live on the Analytics page.
- Hover the mouse (or touch and hold on a phone) anywhere on the line to read the exact time and value at that moment.
- If you had no trade today in the selected mode, the window says "No trading activity yet today" — that is normal, not an error.
Avl. Margin — your broker funds at a glance
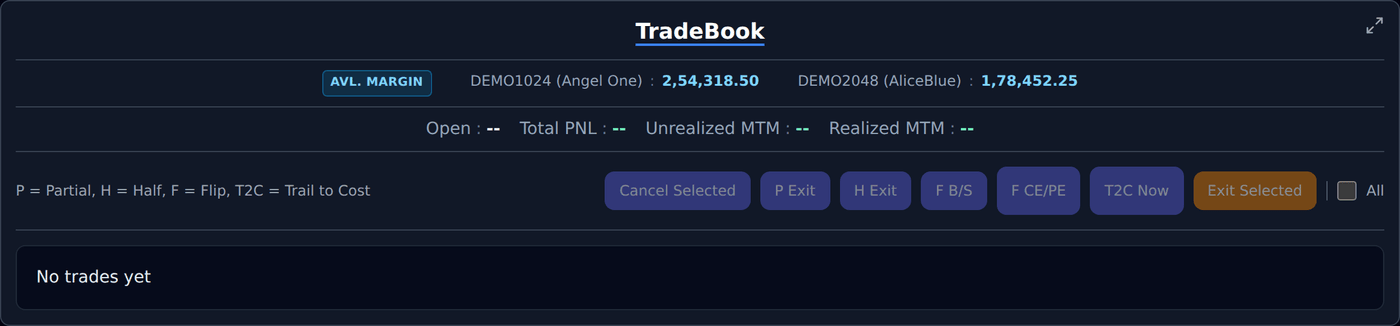
#The Avl. Margin row sits at the top of the TradeBook, just above the Open and Total PNL figures. It shows the available margin — the money free for new trades — in each broker account, so you do not have to open the broker terminal just to check funds.
Only brokers that are currently logged in appear here. If a broker shows in Settings but not in this row, its session is not connected — connect it from Settings and the row picks it up. When no broker is logged in, the row hides itself.
These are always your real broker figures, even in Forward Testing mode. The forward-testing wallet is make-believe money, so showing it here would tell you nothing useful about what you can actually trade.
The figure refreshes about once a minute. For the exact up-to-the-second number — for example just before a large order — your broker terminal is still the place to confirm.
- The same row appears on the TradeBridge, TradeBots and TradeBuilder dashboards, just below Global Controls.
- A broker that is logged in but momentarily not answering shows "--" instead of a number — the other brokers still show theirs.
Trade Book
#Trade Book shows current Trade Scalper trades for active management.
The book includes selection controls and actions such as Exit, Cancel, Edit runtime controls, Partial Exit, Half Exit, T2C Now, Flip B/S, and Flip CE/PE where available. Selected-trade actions can apply to multiple selected active trades.
Recent Trade
#Recent Trade shows the latest active trade in a compact panel.
Use it for quick exit, quick runtime control changes, or T2C/flip actions without searching through the full Trade Book.
Edit runtime controls
#Edit opens runtime controls for an already open Trade Scalper trade.
Exact field names are SL, Target, TSL X, TSL Y, T2C, Exit Delay Sec, If Profit Reach, Lock Min Profit At, Increase in Profits, and Trail Min Profit By. Saving calls the runtime-controls API for that broker order.
Recent trade runtime controls
#Recent trade runtime controls update only the selected running trade, not future trades.
Exact field names are SL, Target, TSL X, TSL Y, T2C, Exit Delay Sec, If Profit Reach, Lock Min Profit At, Increase in Profits, and Trail Min Profit By.
SL changes the running trade stop loss. Target changes profit booking. TSL X is the profit step. TSL Y is how much SL moves after each TSL X step. T2C moves SL to entry price after profit reaches the T2C trigger. Exit Delay Sec waits before sending an exit.
BUY example: entry Rs 100, initial SL Rs 90, TSL X 10, TSL Y 5. When price reaches Rs 110, SL moves to Rs 95. When price reaches Rs 120, SL moves to Rs 100. If T2C is 20, then at Rs 120, SL moves to entry price Rs 100.
Exact field names in the tool are If Profit Reach, Lock Min Profit At, Increase in Profits, and Trail Min Profit By.
If Profit Reach is the first open-profit level where protection starts. Lock Min Profit At is the minimum profit you want to protect after that first level is reached.
Increase in Profits is the next profit step. Trail Min Profit By is how much the protected minimum profit increases after each step.
Example: If Profit Reach is Rs 1000 and Lock Min Profit At is Rs 500, then when open profit reaches Rs 1000, the system starts protecting Rs 500. If profit later falls to Rs 500, exit can trigger.
Continuing the same example: if Increase in Profits is Rs 500 and Trail Min Profit By is Rs 250, protected profit becomes Rs 750 when open profit reaches Rs 1500. It becomes Rs 1000 when open profit reaches Rs 2000.
Partial Exit
#Partial Exit closes only part of the open quantity.
Example: You have 4 lots open. If you partial exit 1 lot, then 1 lot is closed and 3 lots remain active.
This is useful when you want to book some profit or reduce risk without closing the full trade.
Half Exit
#Half Exit closes around half of the open quantity.
Use it when you want to book partial profit or reduce risk while keeping some position open.
Flip Actions
#Flip B/S switches Buy/Sell direction where supported. Flip CE/PE switches option type where supported.
These are fast actions. Confirm broker, quantity, and segment before using them live.
Cancel action
#Cancel is for orders that are still cancellable.
It is not the same as Exit. Exit closes an open position. Cancel tries to cancel an order that has not completed yet.
Exit All
#Exit All tries to exit all active Trade Scalper positions visible to the account.
Use this carefully. After clicking, confirm exits in Trade Book, Orders, or Positions.
Common BUY example used in docs
#Use this same simple example while reading risk fields: BUY one option at Rs 100, quantity 1, initial SL Rs 90.
Stop Loss 10 points means exit at Rs 90 if the price falls.
Target 30 points means book profit at Rs 130 if the price rises.
Trailing Stop Loss with X 10 and Y 5 means SL moves from Rs 90 to Rs 95 at price Rs 110, then to Rs 100 at price Rs 120, then to Rs 105 at price Rs 130.
Trail To Cost 20 points means SL moves to the entry price Rs 100 only after price reaches Rs 120.